 ZETA (ZETA)
$0.05479 -4.93% 24H
- 50Social Sentiment Index (SSI)- (24h)
- #14Marktimpuls-Ranking (MPR)0
- 324-St. in Social Media- (24h)
- 0%24 Std-Bullisch-Verhältnis2 aktive Meinungsbildner
- Zusammenfassung
- Bullische Signale
- Bärische Signale
Social Sentiment Index (SSI)
- Daten insgesamt50SSI
- SSI-Trend (7-Tage)Preis (7 Tage)StimmungsverteilungBärisch (67%)Extrem bärisch (33%)SSI Einblicke
Marktimpuls-Ranking (MPR)
- Warnungseinblick
Beiträge auf X
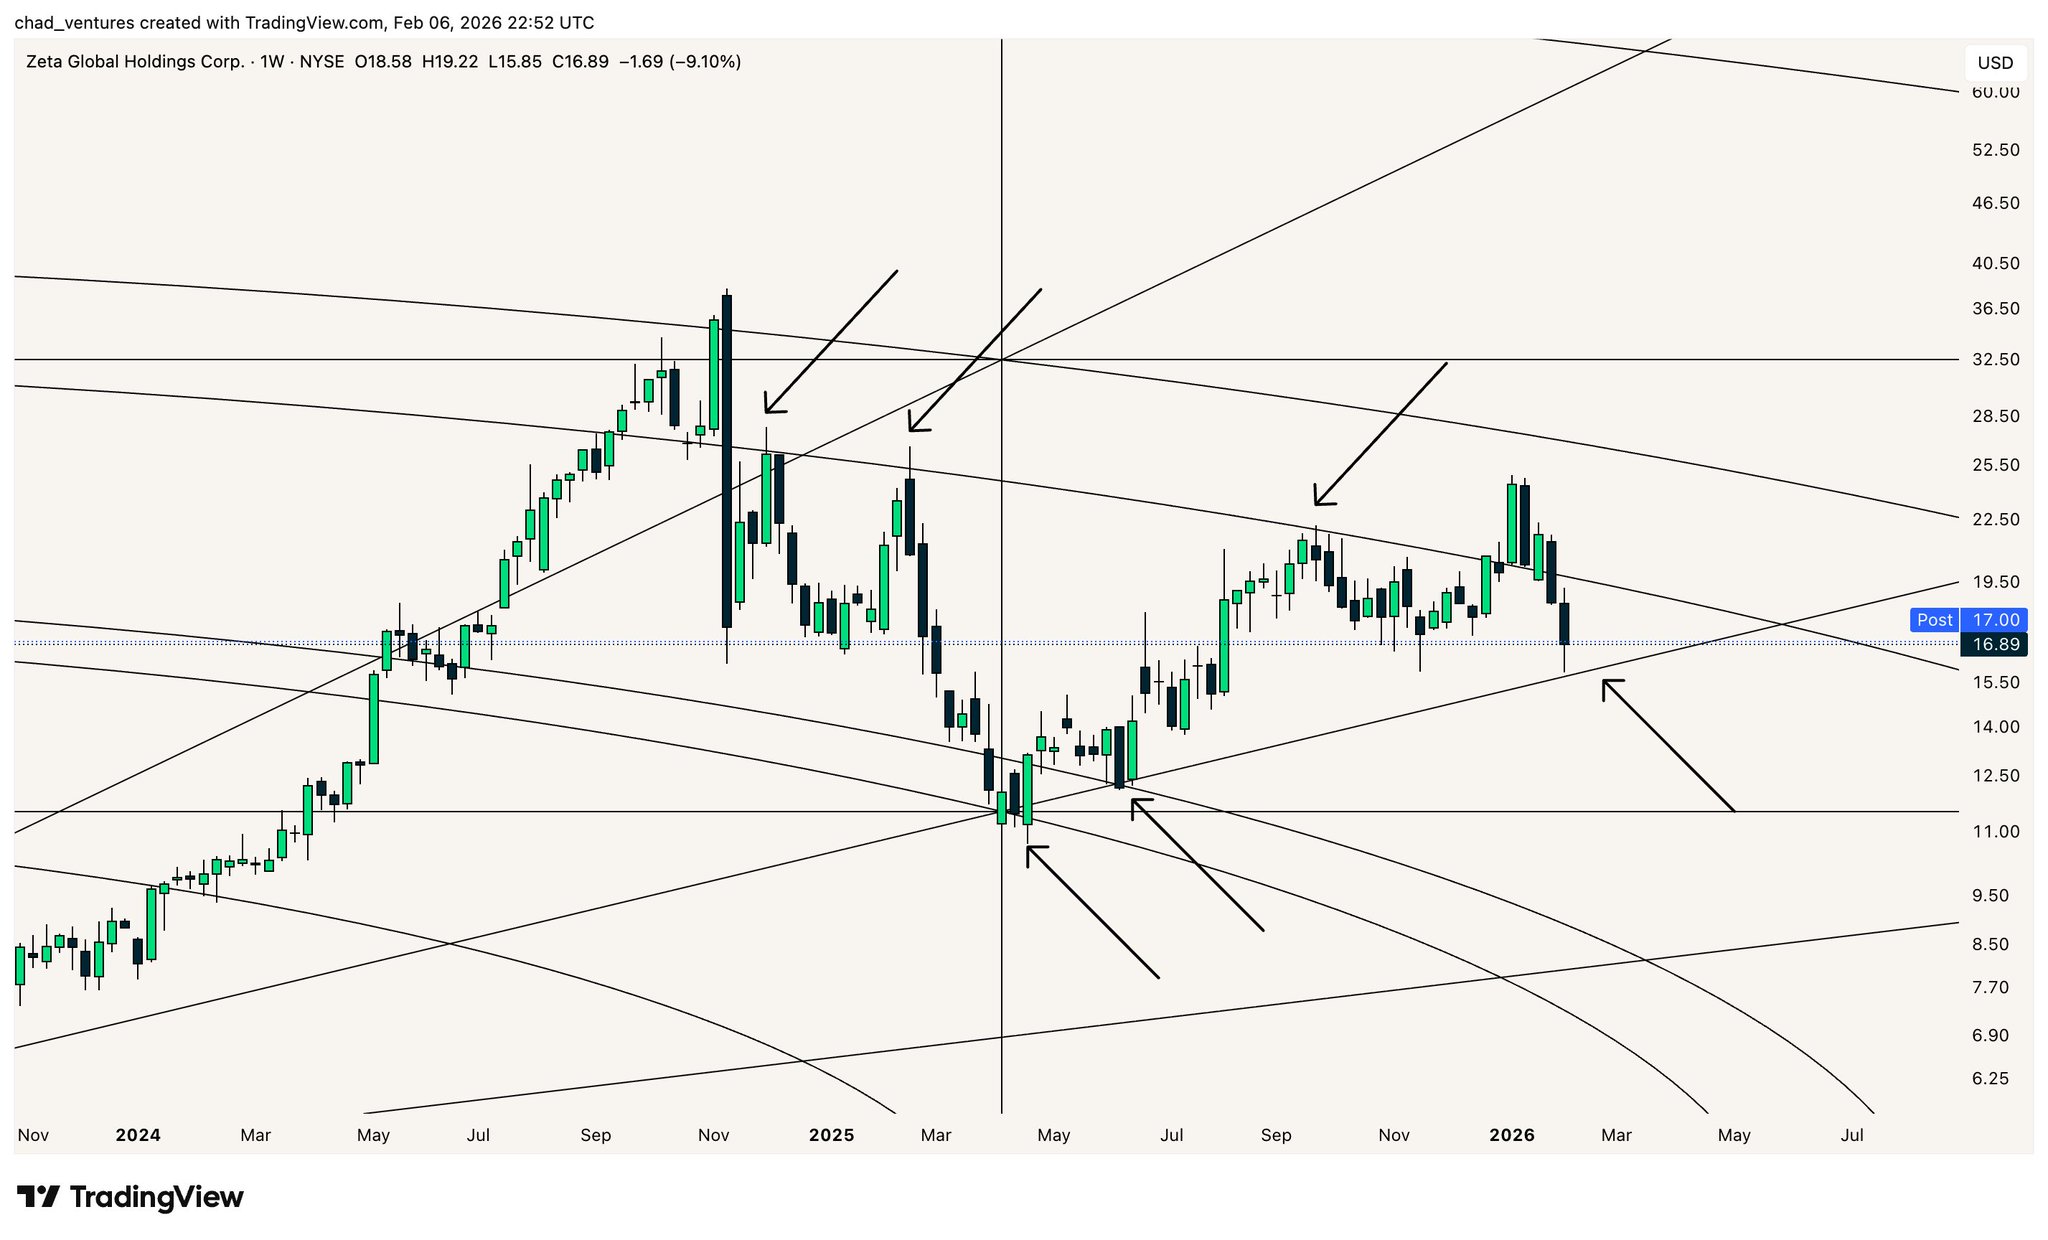
 chad. TA_Analyst Trader B13.31K @chad_ventures
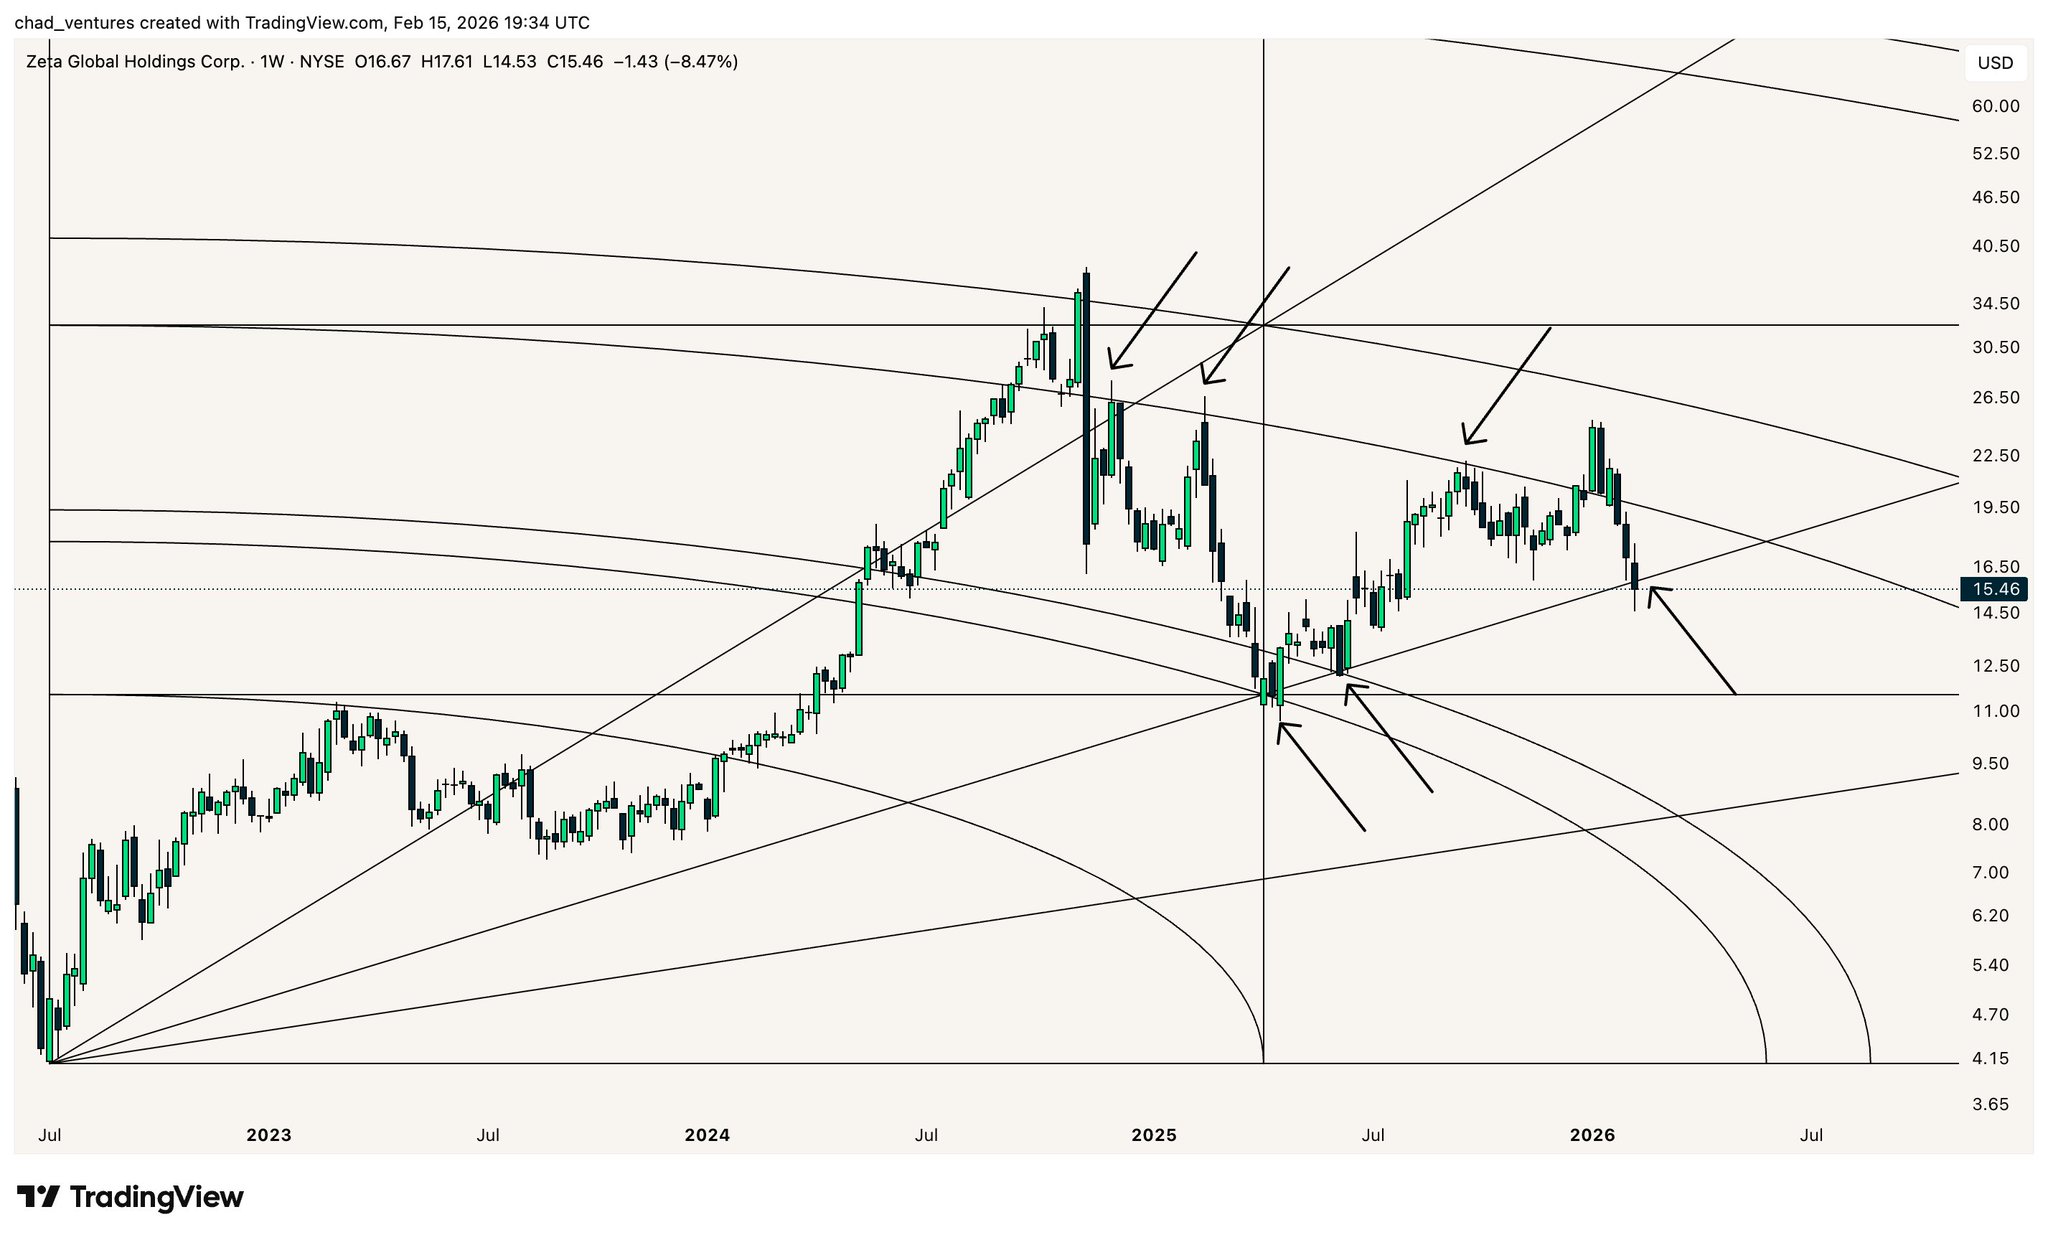 chad. TA_Analyst Trader B13.31K @chad_ventures
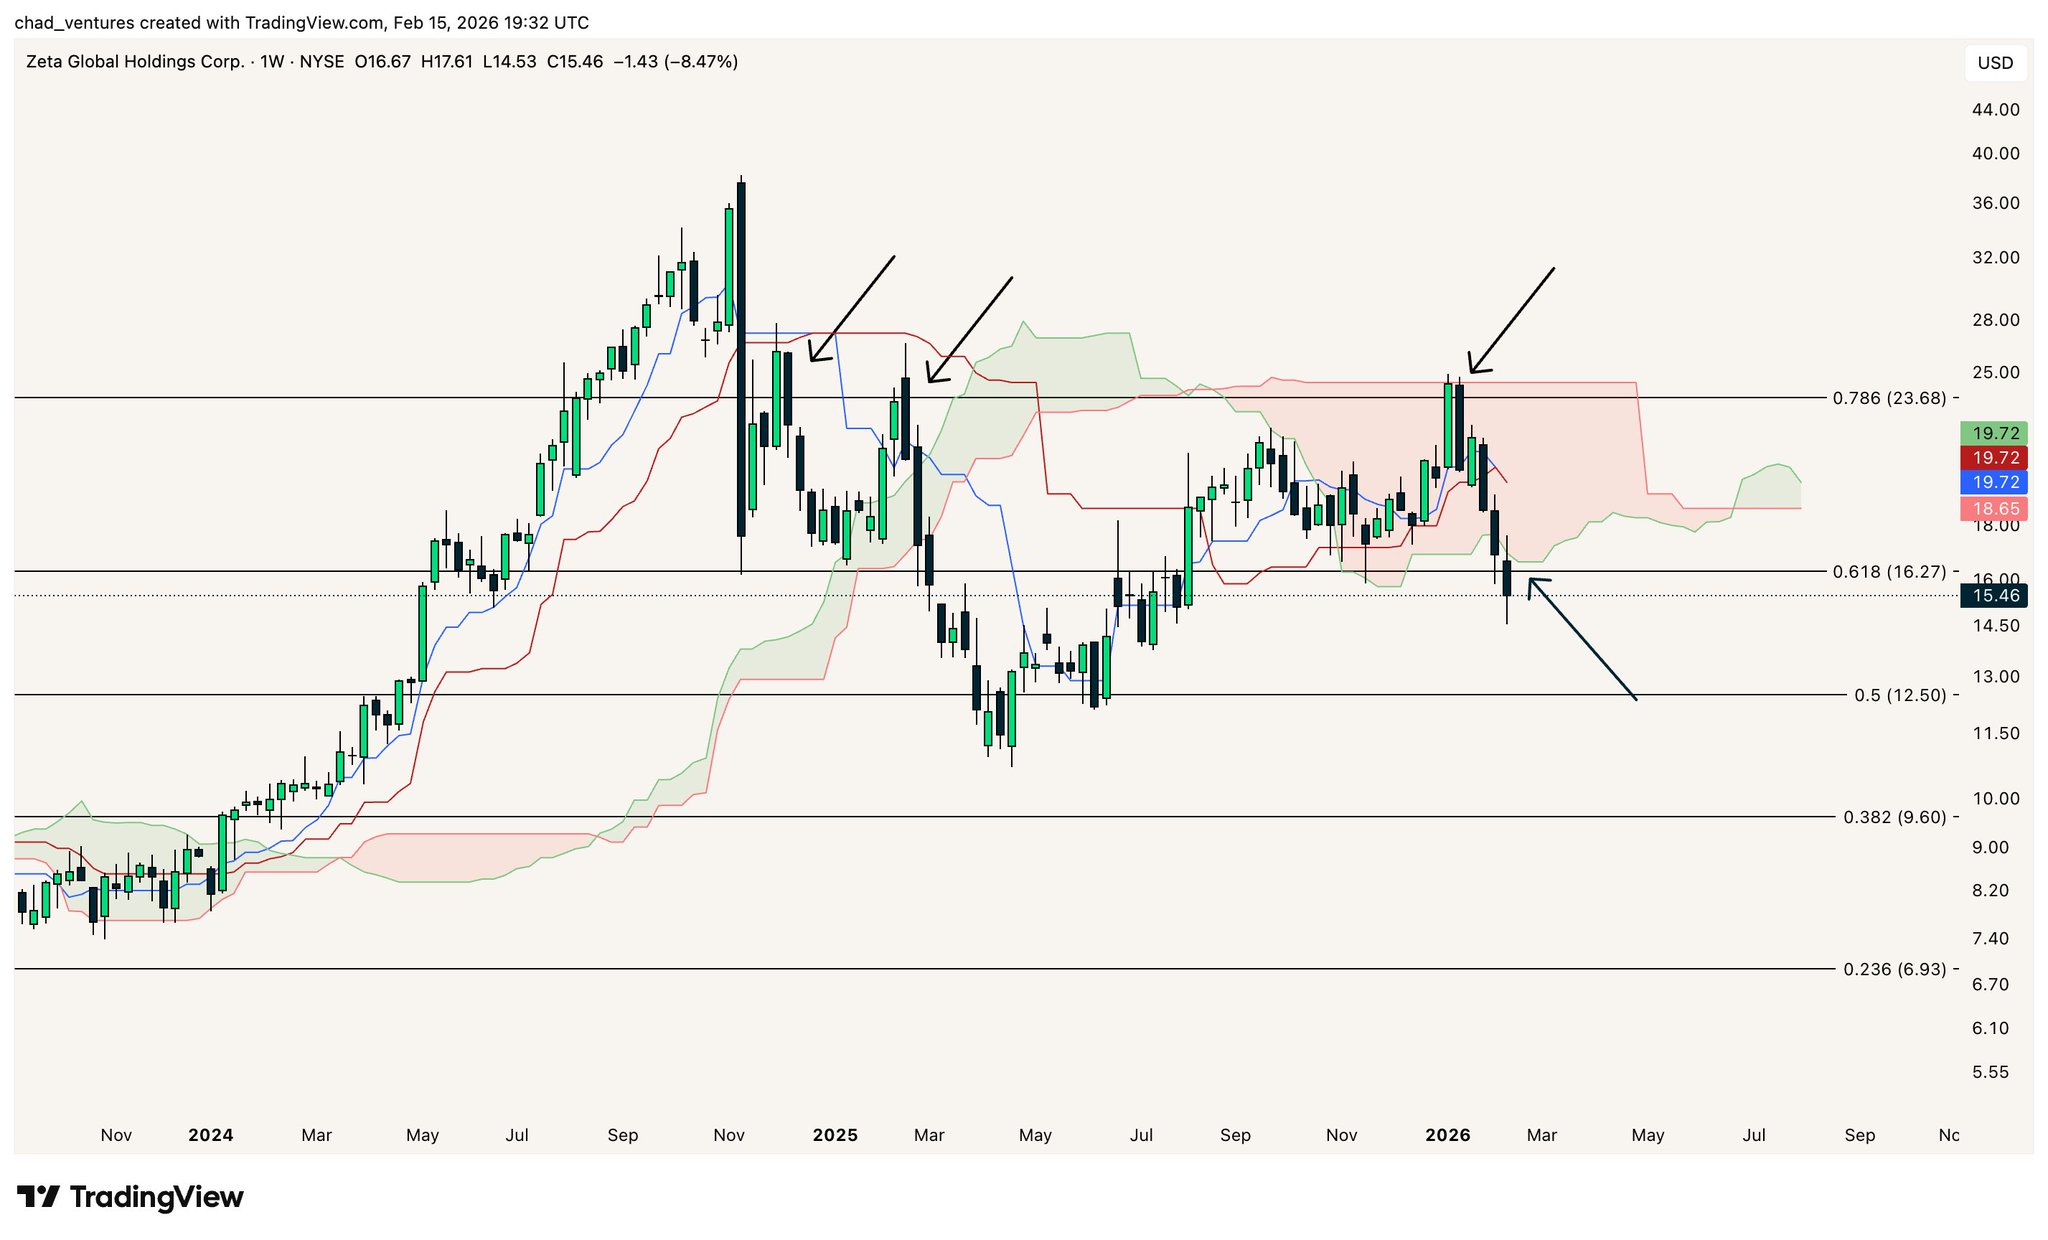 2 0 715 Original >Trend von ZETA nach VeröffentlichungBärisch
- Trend von ZETA nach VeröffentlichungBärisch
 Chris The KOL states in their bio that they have over 10 years of equity and crypto swing trading experience. Their tweets frequently publish detailed technical chart analyses (such as candlestick patterns, Ichimoku, RSI, support and resistance, etc.) along with clear price targets and entry/exit points, making them a typical technical analysis and trading strategy sharer; the extensive buy/short signals and take-profit/stop-loss settings reflect the characteristics of a Trader. Valid A27.68K @StonkChrisChris The KOL states in their bio that they have over 10 years of equity and crypto swing trading experience. Their tweets frequently publish detailed technical chart analyses (such as candlestick patterns, Ichimoku, RSI, support and resistance, etc.) along with clear price targets and entry/exit points, making them a typical technical analysis and trading strategy sharer; the extensive buy/short signals and take-profit/stop-loss settings reflect the characteristics of a Trader. Valid A27.68K @StonkChris
 129 35 20.93K Original >Trend von ZETA nach VeröffentlichungExtrem bärisch
- Chris The KOL states in their bio that they have over 10 years of equity and crypto swing trading experience. Their tweets frequently publish detailed technical chart analyses (such as candlestick patterns, Ichimoku, RSI, support and resistance, etc.) along with clear price targets and entry/exit points, making them a typical technical analysis and trading strategy sharer; the extensive buy/short signals and take-profit/stop-loss settings reflect the characteristics of a Trader. Valid A27.68K @StonkChris129 35 20.93K Original >Trend von ZETA nach VeröffentlichungExtrem bärisch
 Trader Jim TA_Analyst Trader C3.91K @Trades_with_Jim
 Trader Jim TA_Analyst Trader C3.91K @Trades_with_Jim
 1 0 404 Original >Trend von ZETA nach VeröffentlichungExtrem bärisch
- Trend von ZETA nach VeröffentlichungExtrem bullisch
- Trend von ZETA nach VeröffentlichungBullisch
- Trend von ZETA nach VeröffentlichungExtrem bullisch
- chad. TA_Analyst Trader B13.31K @chad_ventures
 chad. TA_Analyst Trader B13.31K @chad_ventures
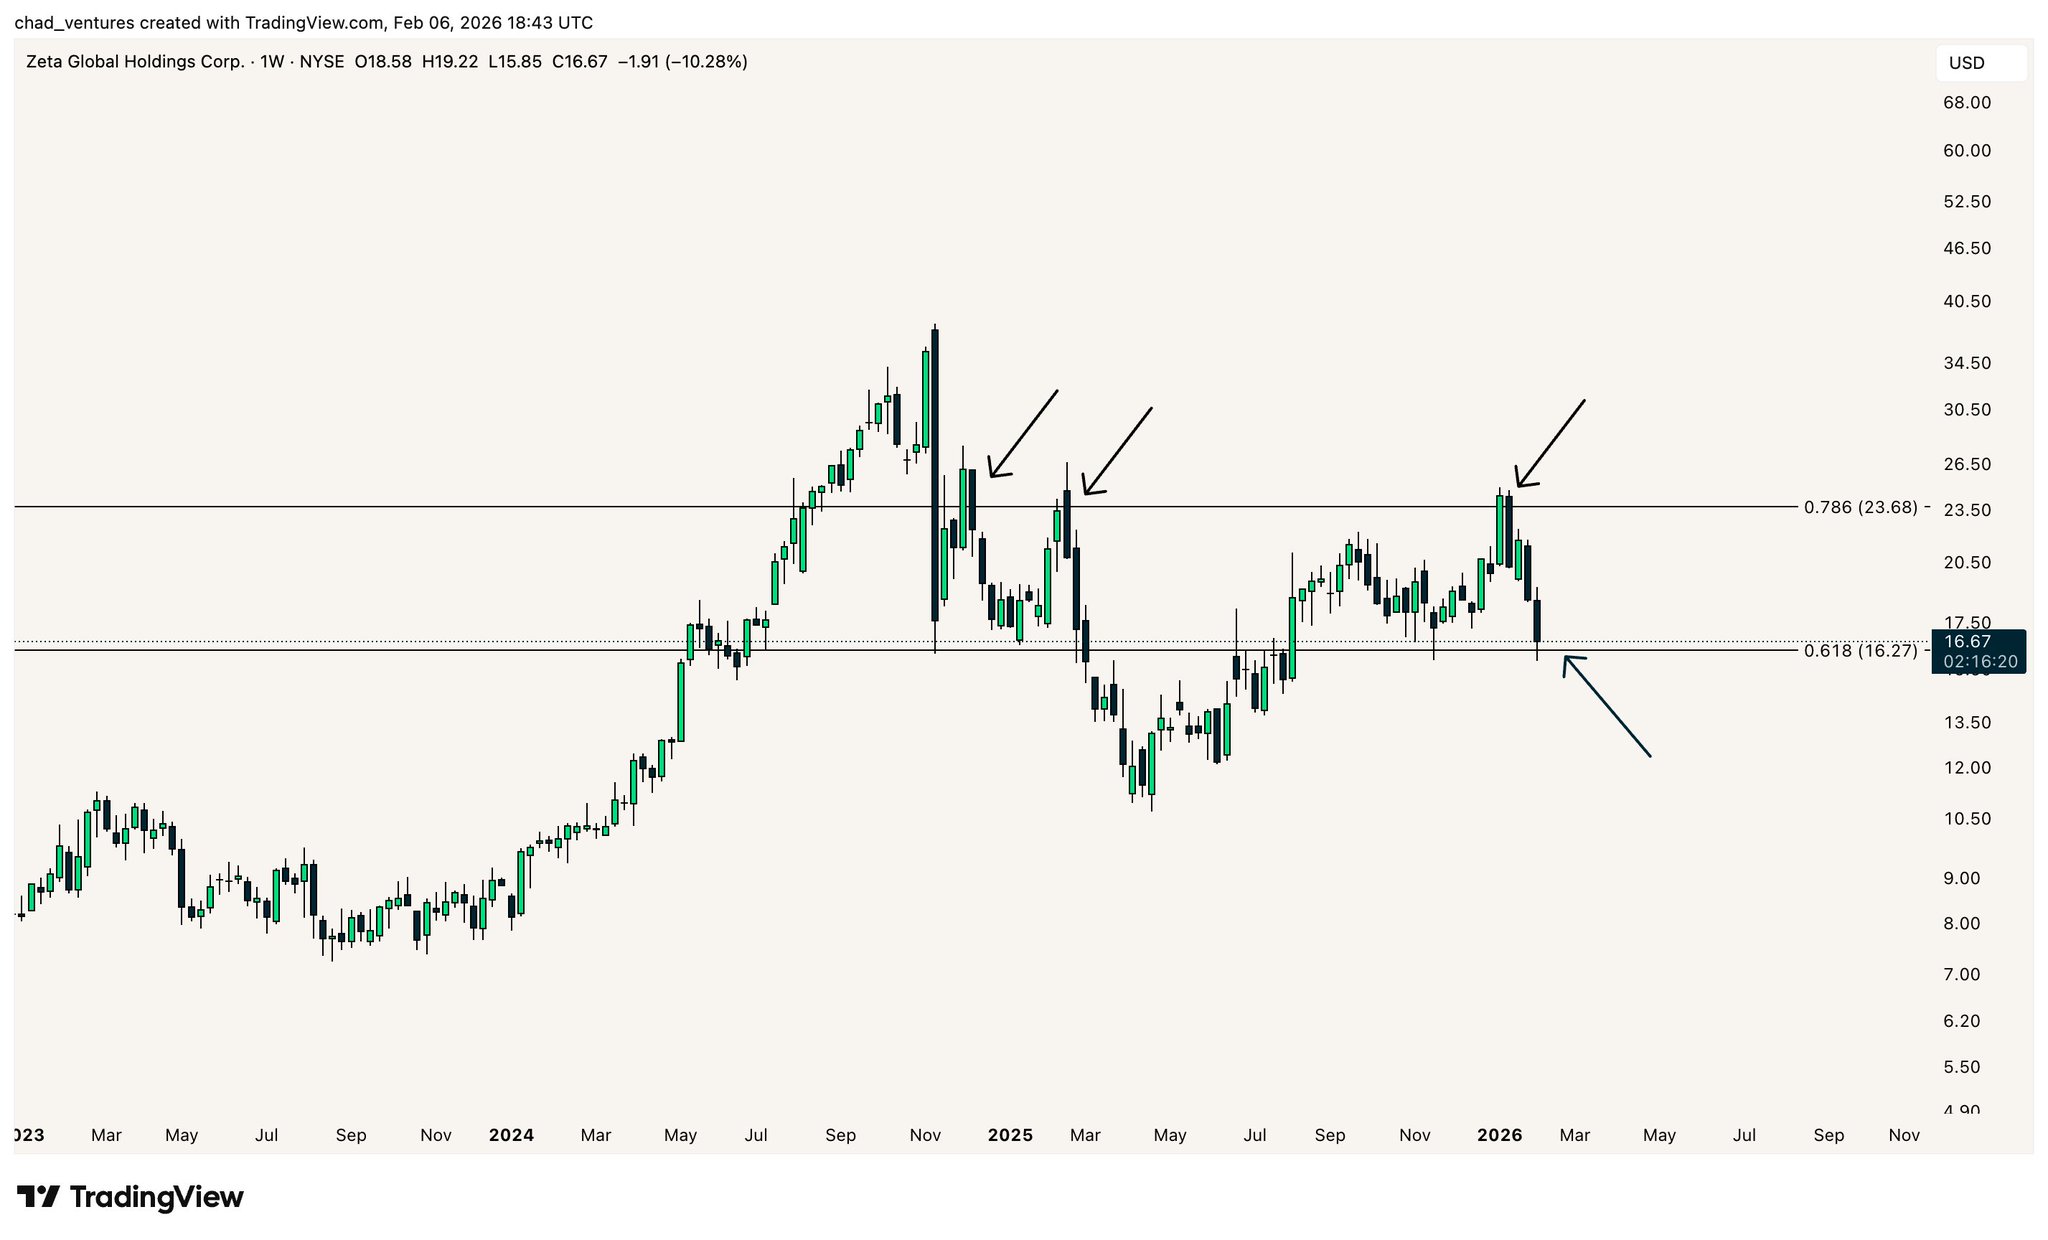 14 0 1.93K Original >Trend von ZETA nach VeröffentlichungNeutral
 - Trend von ZETA nach VeröffentlichungBullisch