Fangen Sie an.
Zum Herunterladen scannen
iOS und Android
BitMart / Krypto / RGTI

Rigetti Computing Tokenized Stock (Robinhood) (RGTI)

$
$ 16.58 (RGTI/USD)
-5.74%
24H

Rigetti Computing Tokenized Stock (Robinhood) Live Kursdaten

Der heutige Preis von Rigetti Computing Tokenized Stock (Robinhood) ist $ 16.58 (RGTI/USD). Mit einer Marktkapitalisierung von $ 2,386.32 USD. 24-Stunden-Handelsvolumen von $ 0 USD, Eine 24-Stunden-Preisänderung von -5.74%, Sowie einer Umlaufmenge von 143.95 RGTI.

Rigetti Computing Tokenized Stock (Robinhood) RGTI Preisverlauf USD

Verfolgen Sie den Preis von Rigetti Computing Tokenized Stock (Robinhood) für heute, 7 Tage, 30 Tage und 90 Tage
Zeitraum
Ändern
Veränderung (%)
Heute
$ 1.01
-5.74%
7Tage
$ 1.10
-6.02%
30Tage
$ 1.31
-7.09%
90Tage
$ 1.31
-7.09%

Besitzen Sie RGTI jetzt

Kaufen und verkaufen Sie RGTI einfach und sicher auf BitMart.
Jetzt RGTI kaufen/verkaufen
Jetzt {0} kaufen/verkaufen
Rigetti Computing Tokenized Stock (Robinhood) Marktinformationen
Letzter Preis $ 16.58
$ 16.54 24-Std.-Bereich $ 17.59
Allzeithoch
‎$ 19.34‎
Allzeittief
‎$ 16.54‎
24-Std.-Veränderung
‎-5.74%‎
Menge 24 Std.
‎$ 0‎
Zirkulierendes Angebot
143.95 RGTI
Marktobergrenze
‎$ 2,386.32‎
Nettomenge
--
Vollständig verwässerte Marktobergrenze
‎$ 2,386.32‎
Handel RGTI

Verdienen

Setzen Sie Ihre ungenutzten Kryptowährungen ein und erzielen Sie passives Einkommen durch Ersparnisse, Staking und mehr.
Jetzt versuchen
Jetzt versuchen

Rigetti Computing Tokenized Stock (Robinhood) X Insight

avatar
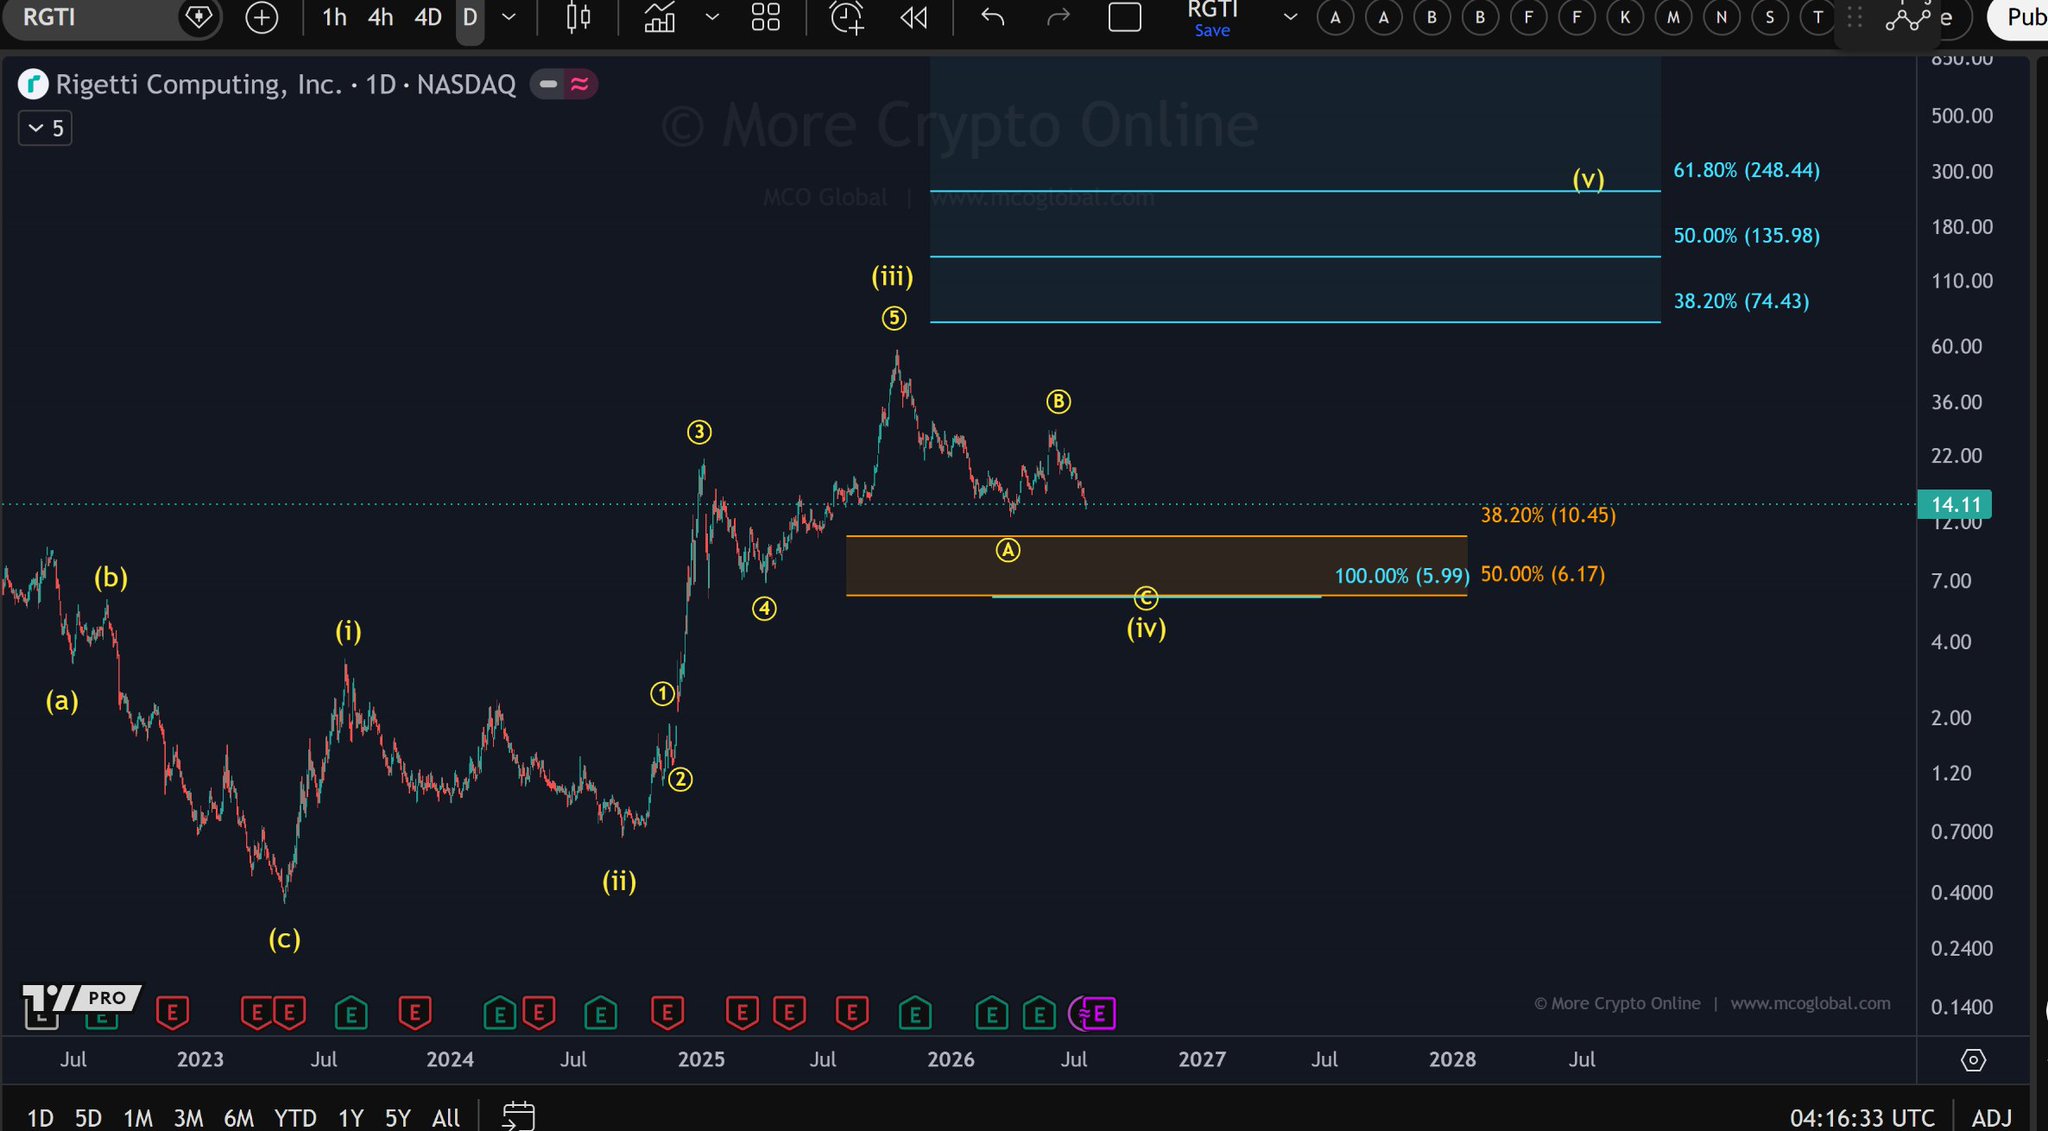
RGTI is in a correction phase, expected to fall to the $5.99-$10.45 support zone.

$RGTI
RGTI remains in a correction phase from the peak of wave (iii), and the move from the peak of wave B still aligns with a still-unfinished decline of wave C.
Leading scenario: The preferred view is that wave (iv) is still incomplete. The decline from the peak of wave B could continue towards the orange support zone between 10,45 $ and 6,17 $, with the 100% C-wave extension around 5,99 $. A move into this area would still fit the structure of the correcting wave (iv) and would not invalidate the count.
Risk scenario: Should the price reverse strongly before reaching the lower support zone and rise back above the recent recovery high, wave (iv) may have completed earlier than expected. On the downside, a sustained break below the 6 $ region would make the correction deeper than ideal and increase the likelihood of a more complex structure.
Key support levels: 10,45 $ / 6,17 $ / 5,99 $ Key resistance levels: 74,43 $ / 136 $ / 248 $ Conclusion: RGTI continues to be viewed as an unfinished (iv) correction wave, with the C-wave decline allowed to extend into the support zone of 10,45 $ to 5,99 $ before a larger (v) wave attempt becomes relevant.
view 22
view 1
view 2.3K
2026-07-18 07:12
Trend von RGTI nach Veröffentlichung
Bärisch
RGTI is in a correction phase, expected to fall to the $5.99-$10.45 support zone.
avatar
RGTI and IONQ gain fresh attention, retail funds shift to quantum AI

🧠 Quantum names $RGTI and $IONQ are pulling fresh attention as retail rotates out of crowded mega-cap AI.

view 7
view 1
view 6.9K
2026-07-07 07:27
Trend von RGTI nach Veröffentlichung
Bullisch
RGTI and IONQ gain fresh attention, retail funds shift to quantum AI
avatar
RGTI is hovering around the $15.30 support level, with a breakout still pending confirmation.

$RGTI
RGTI trades between the next support at $15.30 and the red Fibonacci resistance zone above it. The yellow and blue counts remain fairly balanced, with the proposed wave 1 circle still speculative and should be viewed more as a potential leading diagonal rather than a clear impulse.
Leading scenario: The yellow count can be seen as a possible 1-2 setup, with wave 2 circle still correcting after the rise in May. Holding the area around $15.30 would keep this structure intact, but the next upward attempt needs a stronger reaction before the bullish price gains weight. Risk scenario: Should the $15.30 level give way, the blue ABC interpretation becomes more likely. This would shift focus to the lower red support and possibly the orange support zone, where a C‑wave decline could develop before a larger trend reversal is attempted. Key support levels: $15.30 / ~$12.80 / $10.50–6.20
Key resistance levels: $27.11–49.17
Conclusion: For RGTI there is still no clear advantage between the yellow and blue scenarios. $15.30 is the first level that decides whether the potential 1-2 setup can hold or whether the deeper correction path takes precedence.

view 6
view 1
view 1.8K
2026-07-04 09:12
Trend von RGTI nach Veröffentlichung
Neutral
RGTI is hovering around the $15.30 support level, with a breakout still pending confirmation.
Einzelheiten

Preisprognose

Wann ist ein guter Zeitpunkt, um RGTI zu kaufen? Soll ich RGTI jetzt kaufen oder verkaufen?

Bei der Entscheidung, ob es ein guter Zeitpunkt ist, Rigetti Computing Tokenized Stock (Robinhood) (RGTI) zu kaufen oder zu verkaufen, ist es wichtig, sich zunächst an der eigenen Handelsstrategie und Ihrem Risikoprofil zu orientieren. Langfristig orientierte Anleger und kurzfristig orientierte Trader interpretieren Marktbedingungen oft unterschiedlich, daher sollte Ihre Entscheidung Ihre persönliche Herangehensweise widerspiegeln. Laut der neuesten vierstündigen technischen Analyse von RGTI lautet das aktuelle Handelssignal Halten.
60
Halten
4-stündige technische Analyse von RGTI
Letzte Aktualisierung 2026-08-20 11:59:59
beacon

Beacon Vorhersage

Probabilistische Preisprognose (nächste 24 Stunden)
i
Haftungsausschluss für Beacon-Vorhersagen
Die auf dieser Seite angezeigten Datenergebnisse werden basierend auf tatsächlichen Handelsdaten (OHLCV) des ausgewählten Handelspaares und den entsprechenden technischen Indikatoren analysiert.
Diese Prognose ist ein experimentelles technisches Produkt und wird lediglich zu Informationszwecken angegeben. Dies stellt keine Anlageberatung dar. Unerwartete Ereignisse in der realen Welt können erhebliche Auswirkungen auf das Marktverhalten haben. Händler sollten Entscheidungen mit Vorsicht treffen.
Über Rigetti Computing Tokenized Stock (Robinhood)
Rigetti Computing Tokenized Stock (Robinhood) (RGTI) is a cryptocurrency and operates on the Robinhood Chain platform. Rigetti Computing Tokenized Stock (Robinhood) has a current supply of 143.953. The last known price of Rigetti Computing Tokenized Stock (Robinhood) is 18.86331123 USD and is up 0.60 over the last 24 hours. It is currently trading on 11 active market(s) with $0.00 traded over the last 24 hours. More information can be found at https://robinhood.com/us/en/.
Mehr lesen