Rewards
Futures Daily Draw
100% Chance To Win With Daily Trades
Spot Daily Draw
Win 8,888 USDT In Grand Prizes
Mobile Top-Up
Top up mobiles easily, online, secure
Send
Send money globally, fast and secure
BitMart Mall
Live on crypto

Render Live Price data
Today's price of Render Is $ 1.50 (RENDER/USD). With A Market Cap Of $ 778.89M USD. 24-Hour Trading Volume Of $ 1.43M USD, A 24-Hour Price Change Of -0.53%, And A Circulating Supply Of 518.77M RENDER.
Render RENDER Price History USD
Track the price of Render for today, 7 days, 30 days and 90 days
Period
Change
Change (%)
Today
$ 0.0079
-0.53%
7days
$ 0.073
-4.70%
30days
$ 0.60
-28.58%
90days
$ 0.15
-9.13%
Own RENDER Now
Buy and sell RENDER easily and securely on BitMart.
Render Market Information
$ 1.47 24h Range $ 1.56
All time high
$ 11.80
All time low
$ 0.55
24h Change
-0.53%
24h Vol
$ 1,431,566.95
Circulating supply
0.51B
RENDER
Market cap
$ 778.89M
Max supply
0.64B
RENDER
Fully diluted market cap
$ 967.16M
Trade RENDER

Render X Insight

2xnmore
FA_Analyst
OnChain_Analyst
B
 45.2K @2xnmore
 Neutral
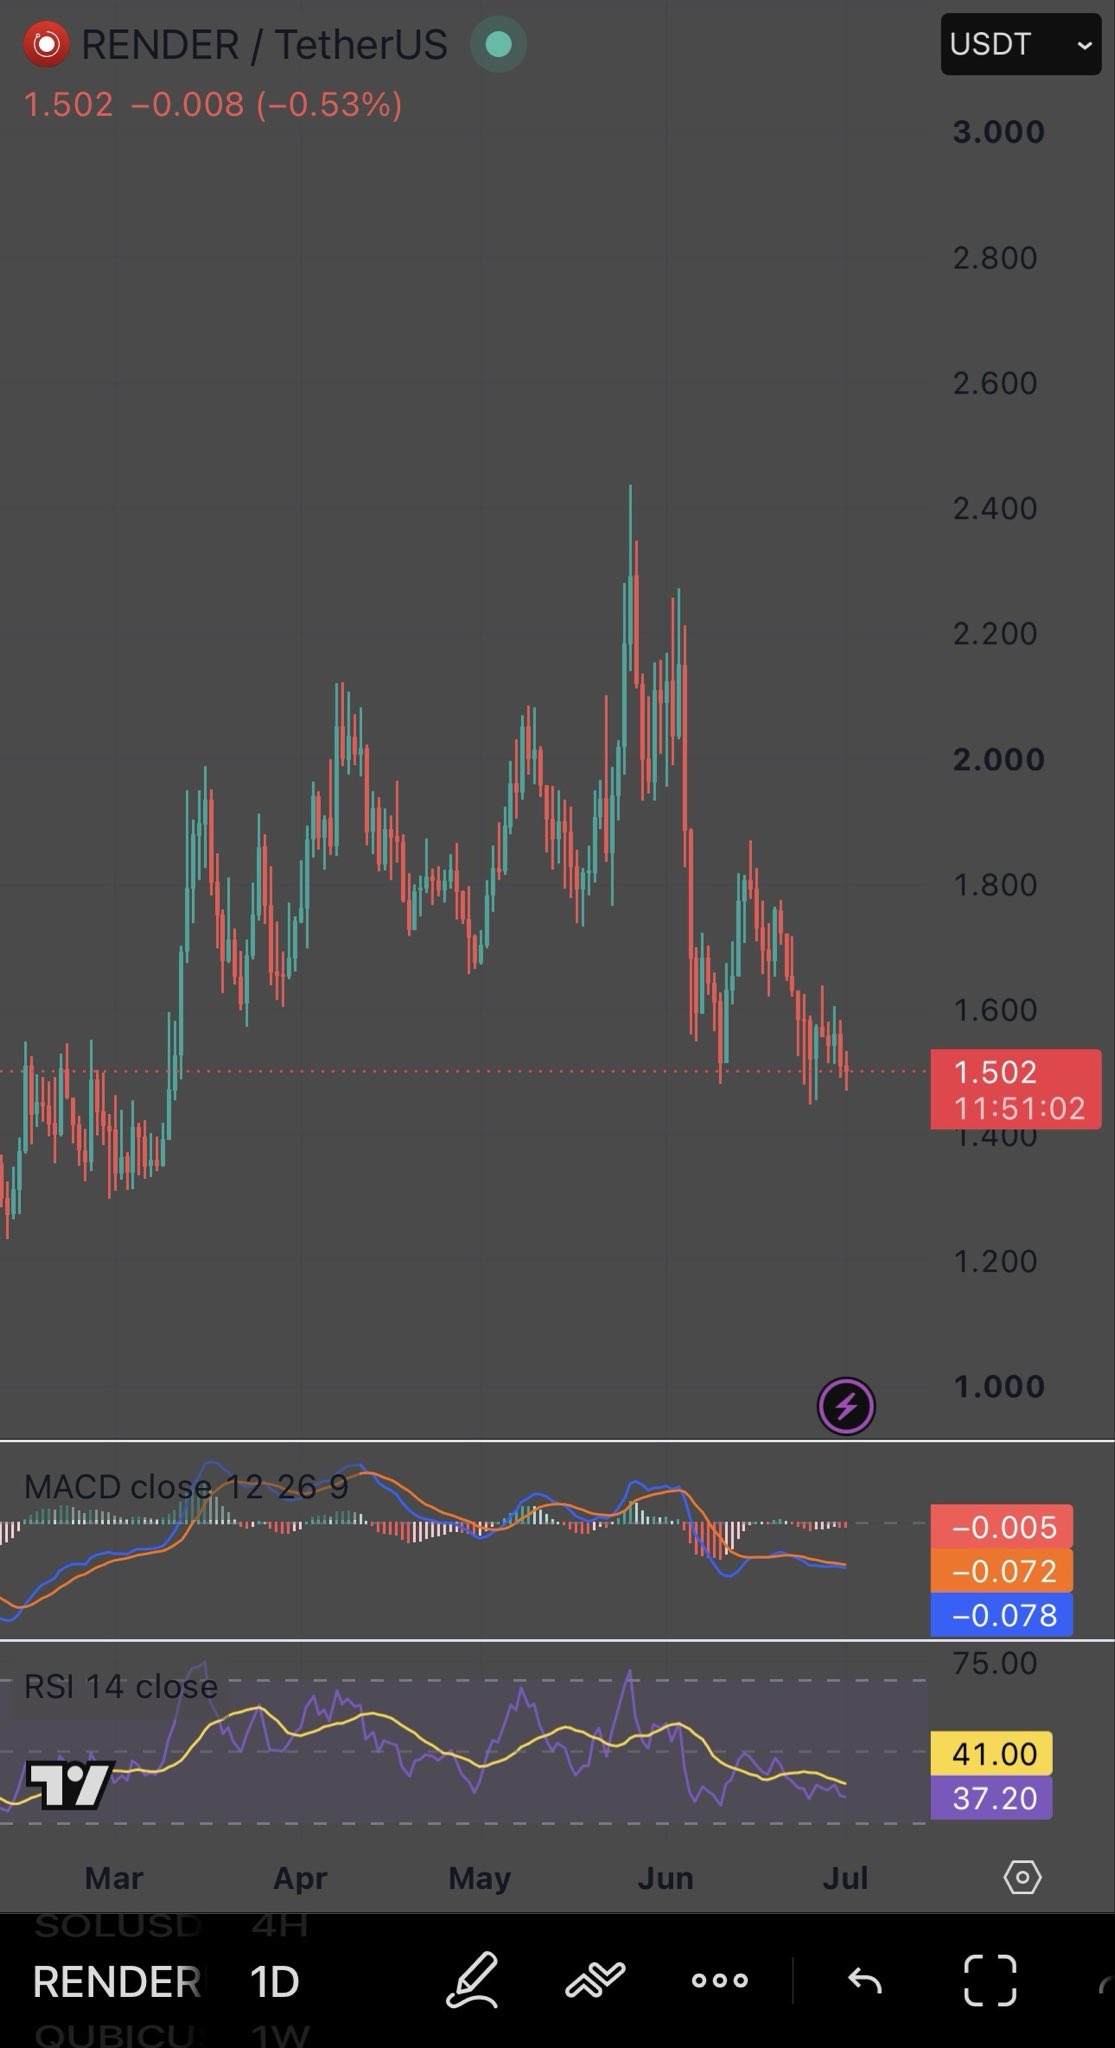
RENDER/USDT has slipped to the critical support zone of 1.50-1.60, technical indicators are weak, and bottom signals need to be observed.
2xnmore
FA_Analyst
OnChain_Analyst
B
45.2K @2xnmore Everyone celebrated $RENDER hitting 2.40 in June.
Almost nobody noticed the divergence forming underneath it.
RENDER/USDT is sitting at 1.502 right now, down over 35% from that high.
RSI made a lower high while price made a higher high in June.
That is the market quietly telling you the move was running on fumes before the candles ever turned red.
MACD is still negative, histogram red, signal line trailing below the MACD line. No bullish cross has printed yet.
RSI 14 is at 41, still under the midline that separates strength from weakness.
Here is the part that matters. Price is now retesting the exact 1.50 to 1.60 zone that acted as support back in March and April. That level has held before.
The people who only watch price are panicking right now.
The people who watch structure are watching for RSI to reclaim 40 and for that MACD histogram to start contracting.
That combination usually shows up before the crowd believes a bottom is real.
Until then, this is a level to watch, not a level to chase.
 66
66
 13
13
 4.2K
4.2K
2026-07-01 23:27
Trend of RENDER after release
Neutral
RENDER/USDT has slipped to the critical support zone of 1.50-1.60, technical indicators are weak, and bottom signals need to be observed.
2xnmore
FA_Analyst
OnChain_Analyst
B
45.2K @2xnmore Bullish
RENDER/USDT has slipped to the critical support zone of 1.50-1.60, technical indicators are weak, and bottom signals need to be observed.
Everyone celebrated $RENDER hitting 2.40 in June.
Almost nobody noticed the divergence forming underneath it.
RENDER/USDT is sitting at 1.502 right now, down over 35% from that high.
RSI made a lower high while price made a higher high in June.
That is the market quietly telling you the move was running on fumes before the candles ever turned red.
MACD is still negative, histogram red, signal line trailing below the MACD line. No bullish cross has printed yet.
RSI 14 is at 41, still under the midline that separates strength from weakness.
Here is the part that matters. Price is now retesting the exact 1.50 to 1.60 zone that acted as support back in March and April. That level has held before.
The people who only watch price are panicking right now.
The people who watch structure are watching for RSI to reclaim 40 and for that MACD histogram to start contracting.
That combination usually shows up before the crowd believes a bottom is real.
Until then, this is a level to watch, not a level to chase.
66
13
4.2K
2026-07-01 12:17
Trend of RENDER after release
Bullish
RENDER/USDT has slipped to the critical support zone of 1.50-1.60, technical indicators are weak, and bottom signals need to be observed.

Crypto Patel
TA_Analyst
OnChain_Analyst
B
60.9K @CryptoPatel Extremely Bullish
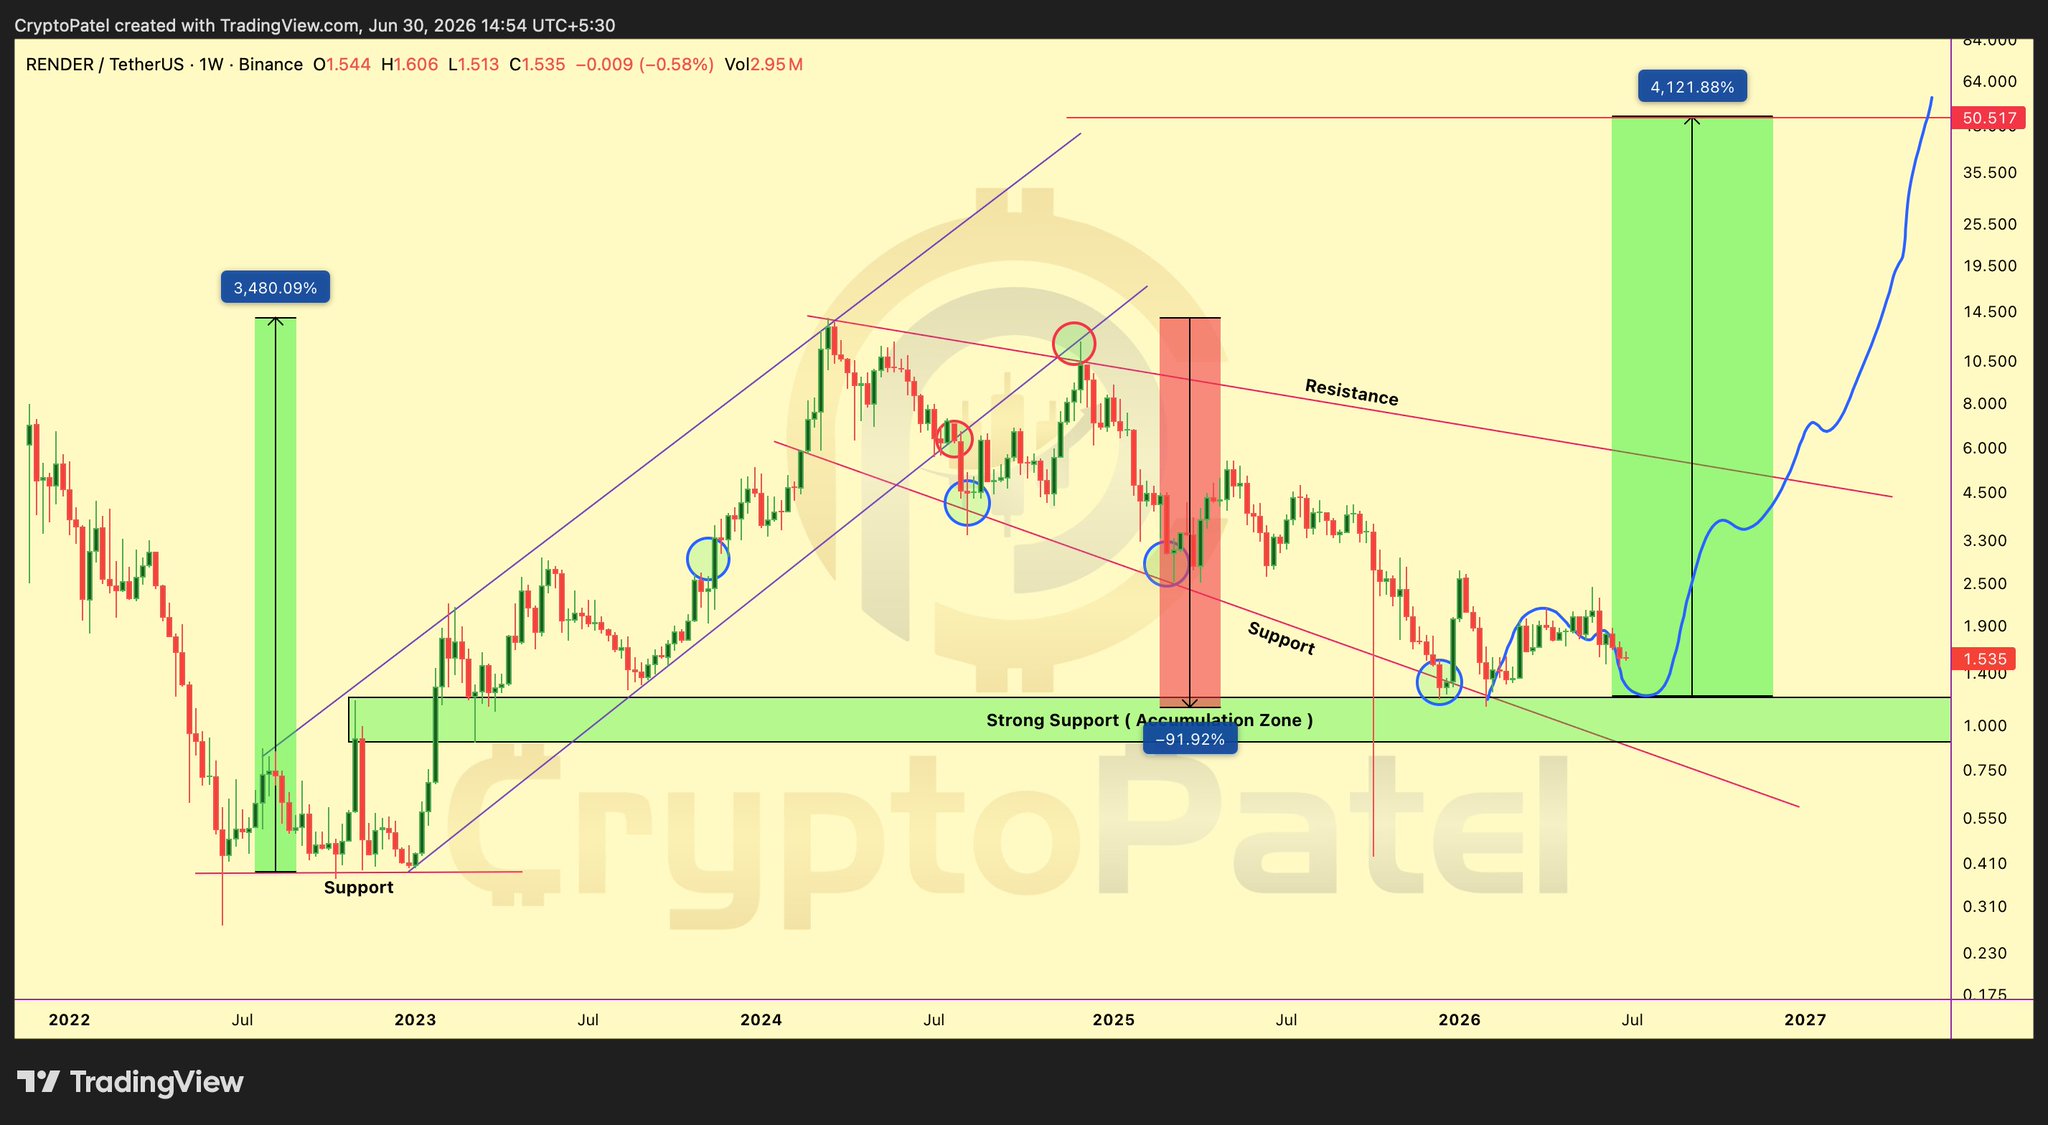
RENDER处于关键累积区,基本面创新高,技术分析预测本周期有望25倍上涨至$50。
Down 92% While Fundamentals Hit ALL-TIME HIGHS: Why $RENDER Could 25x To $50 This Cycle 🚀
#RENDER Is Currently Positioned Within A HTF Bullish OB After Experiencing ~92% Macro Drawdown From Its ATH, Placing Price At A Key Accumulation vs Breakdown Zone.
Technical Structure
✅ Prior Cycle ATH: $13.83 (Macro Top)
✅ Macro Pullback: −92% From ATH Into Present Accumulation Area
✅ Multi-Year Descending Channel Compression Near HTF Demand
✅ HTF Bullish OB: $1.20–$0.80
✅ 0.786 Fibonacci Level: $0.83 (Optimal Accumulation Zone)
✅ Potential Liquidity Grab Below $1 Before Expansion
✅ Bullish Bias Holds While $0.83 Sustains On HTF Closing Basis
✅ Invalidation (Aggressive): HTF Close Below $0.83
Cycle Context
➡️ 2022–2023 Rally: +5,000% Move From $0.274 → $13.83
➡️ 2024–2026 Phase: −92% Corrective Accumulation Range
Key Levels
👉 Primary HTF Demand: $1.20–$0.80
👉 Secondary Support Zone: $0.60–$0.40 (If $0.80 Breaks)
👉 Trend Confirmation: $2.71 (Breakout From Descending Channel)
Bull Cycle Targets: $2.70 → $5.50 → $13.00 → $28+
Invalidation: Weekly Close Below $0.80
The $1.20–$0.80 Range Continues To Act As A Major HTF Accumulation Zone For RENDER/USDT Ahead Of A Potential Next Expansion Leg.
TA Only. Not Financial Advice. Manage Risk.
@render
 274
18
6.3K
274
18
6.3K
2026-06-30 14:37
Trend of RENDER after release
Extremely Bullish
RENDER处于关键累积区,基本面创新高,技术分析预测本周期有望25倍上涨至$50。
Price Prediction
When is a good time to buy RENDER? Should I buy or sell RENDER now?
When deciding whether it’s a good time to buy or sell Render (RENDER), it’s important to first align with your own trading strategy and risk profile.Long-term investors and short-term traders often interpret market conditions differently, so your decision should reflect your personal approach. According to the latest RENDER 4-hour technical analysis, the current trading signal is Hold. According to the latest RENDER 1-day technical analysis, the current signal is Buy.

Beacon Prediction
Probabilistic Price Forecast (Next 24 Hours)Beacon Prediction Disclaimer
The data results displayed on this page are analyzed based on actual trading data (OHLCV) of the selected trading pair along with corresponding technical indicators.
This prediction is an experimental technical product and is provided for reference purposes only. It does not constitute investment advice. Unexpected real-world events may significantly impact market behavior. Traders should make decisions with caution.
This prediction is an experimental technical product and is provided for reference purposes only. It does not constitute investment advice. Unexpected real-world events may significantly impact market behavior. Traders should make decisions with caution.
About Render
Render (RENDER) is a cryptocurrency launched in 2019and operates on the Ethereum platform. Render has a current supply of 533,532,274.56269149 with 518,772,101.28269149 in circulation. The last known price of Render is 1.53113605 USD and is down -1.97 over the last 24 hours. It is currently trading on 653 active market(s) with $21,328,448.33 traded over the last 24 hours. More information can be found at https://rendernetwork.com/.
Read More
Official Links
Explore More
BM Discovery


New Listing

CNT Centel
-- 0.00%

CRDOON Credo Technology Group Holding Ltd
-- 0.00%

BEON Bloom Energy Corp
-- 0.00%

DASHON DoorDash
-- 0.00%

APPON AppLovin Corporation
-- 0.00%

APLDON Applied Digital
-- 0.00%

NEEON NextEra Energy
-- 0.00%

ONON ON Semiconductor Corporation
-- 0.00%

SCHWON The Charles Schwab Corporation
-- 0.00%

ANSEM The Black Bull
-- 0.00%
Buy RENDER
Trade RENDER