$UM @penumbrazone , Daily TF (all charts)
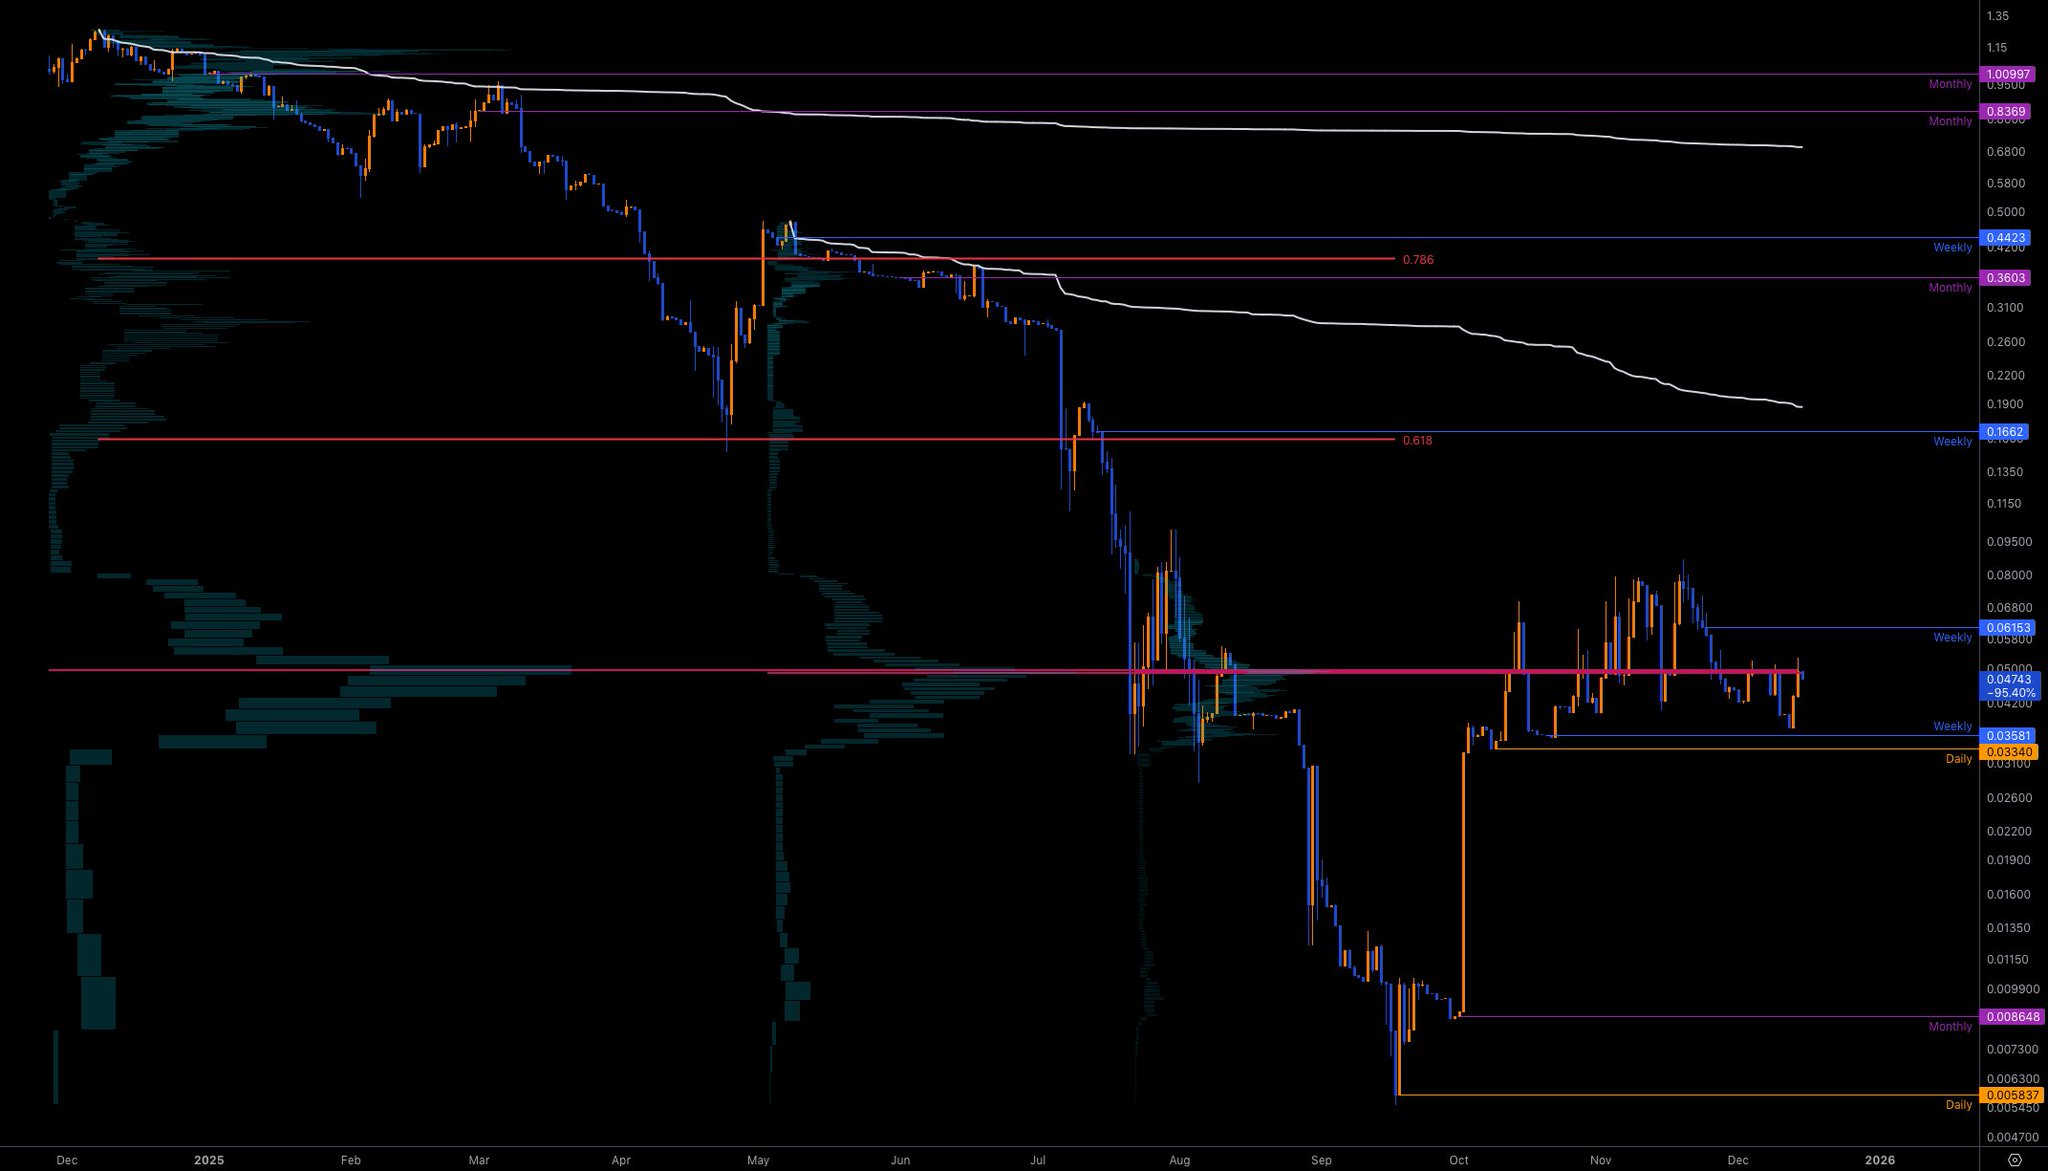
1. More "macro" overview. Looking at the 3 Volume Profiles we can see that all of them have the same POC and the reason is the price action from August 2025 until now. There's a clear range formed before a big drop to below 1 cents and a comeback inside this range (better view on chart 3). Possible resistance zone around 17 and 44 cents (on larger TF).
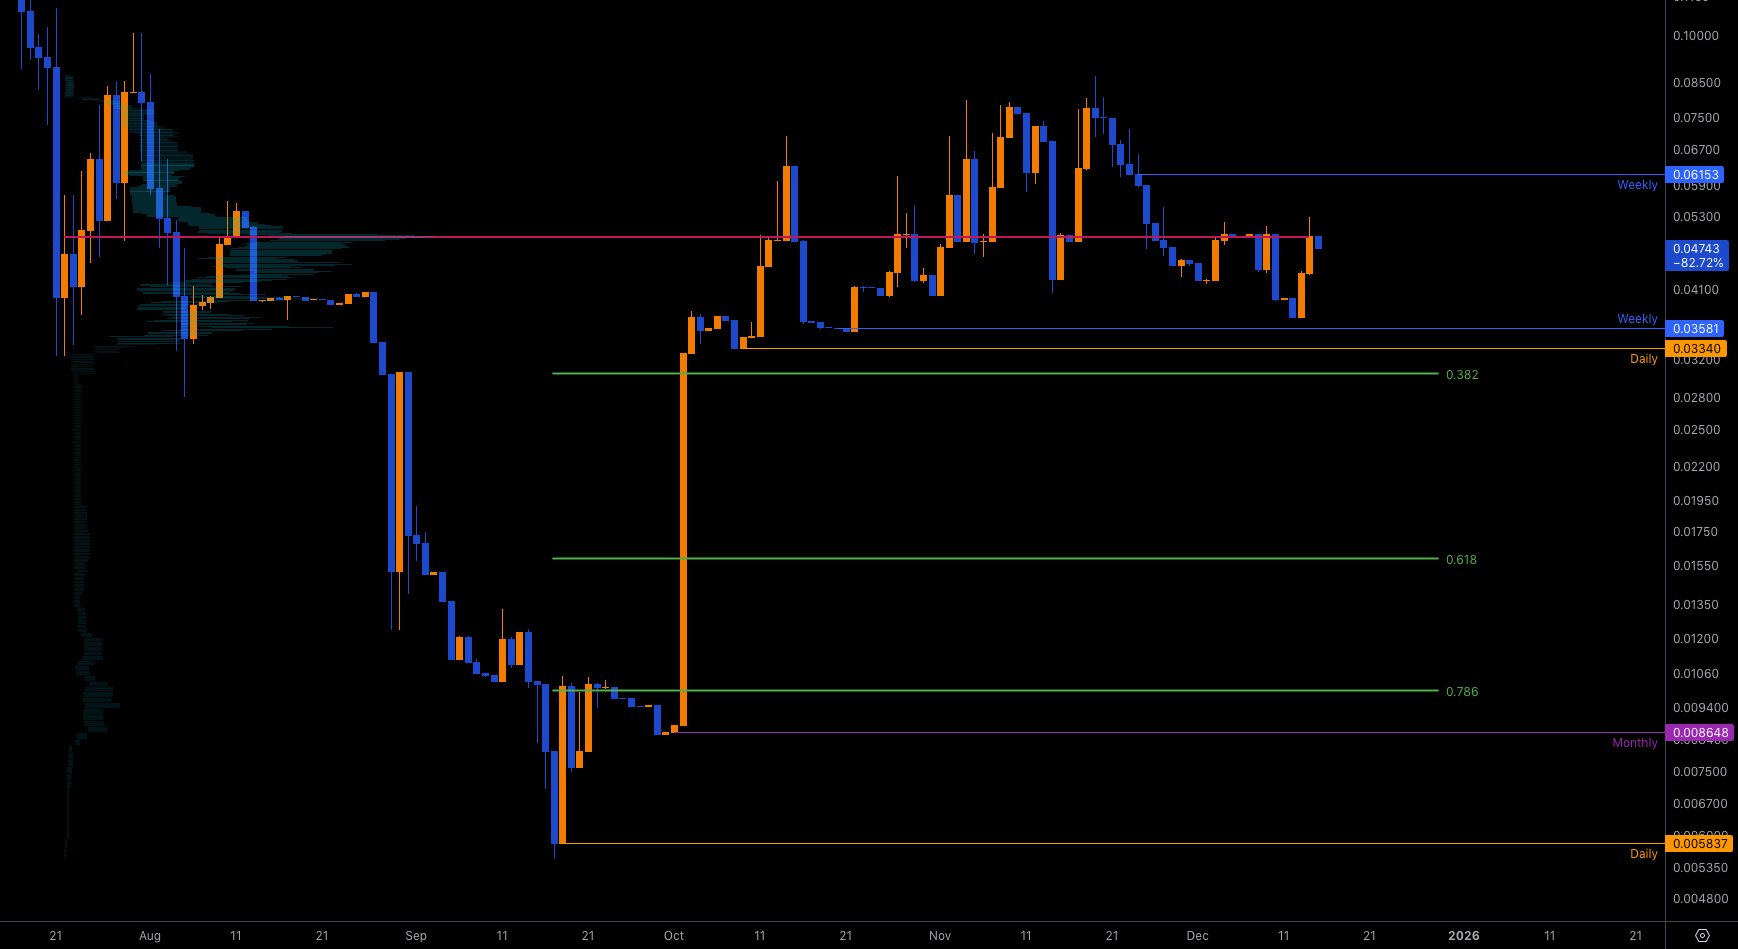
2. Close-up view of the last few months. The pump in the beginning of October left big inefficiency with no market structure or significant voume. Acceptance back below 3 cents or so is a sign of weakness and price could easily drop to .786 or so. Which is 70% drop!
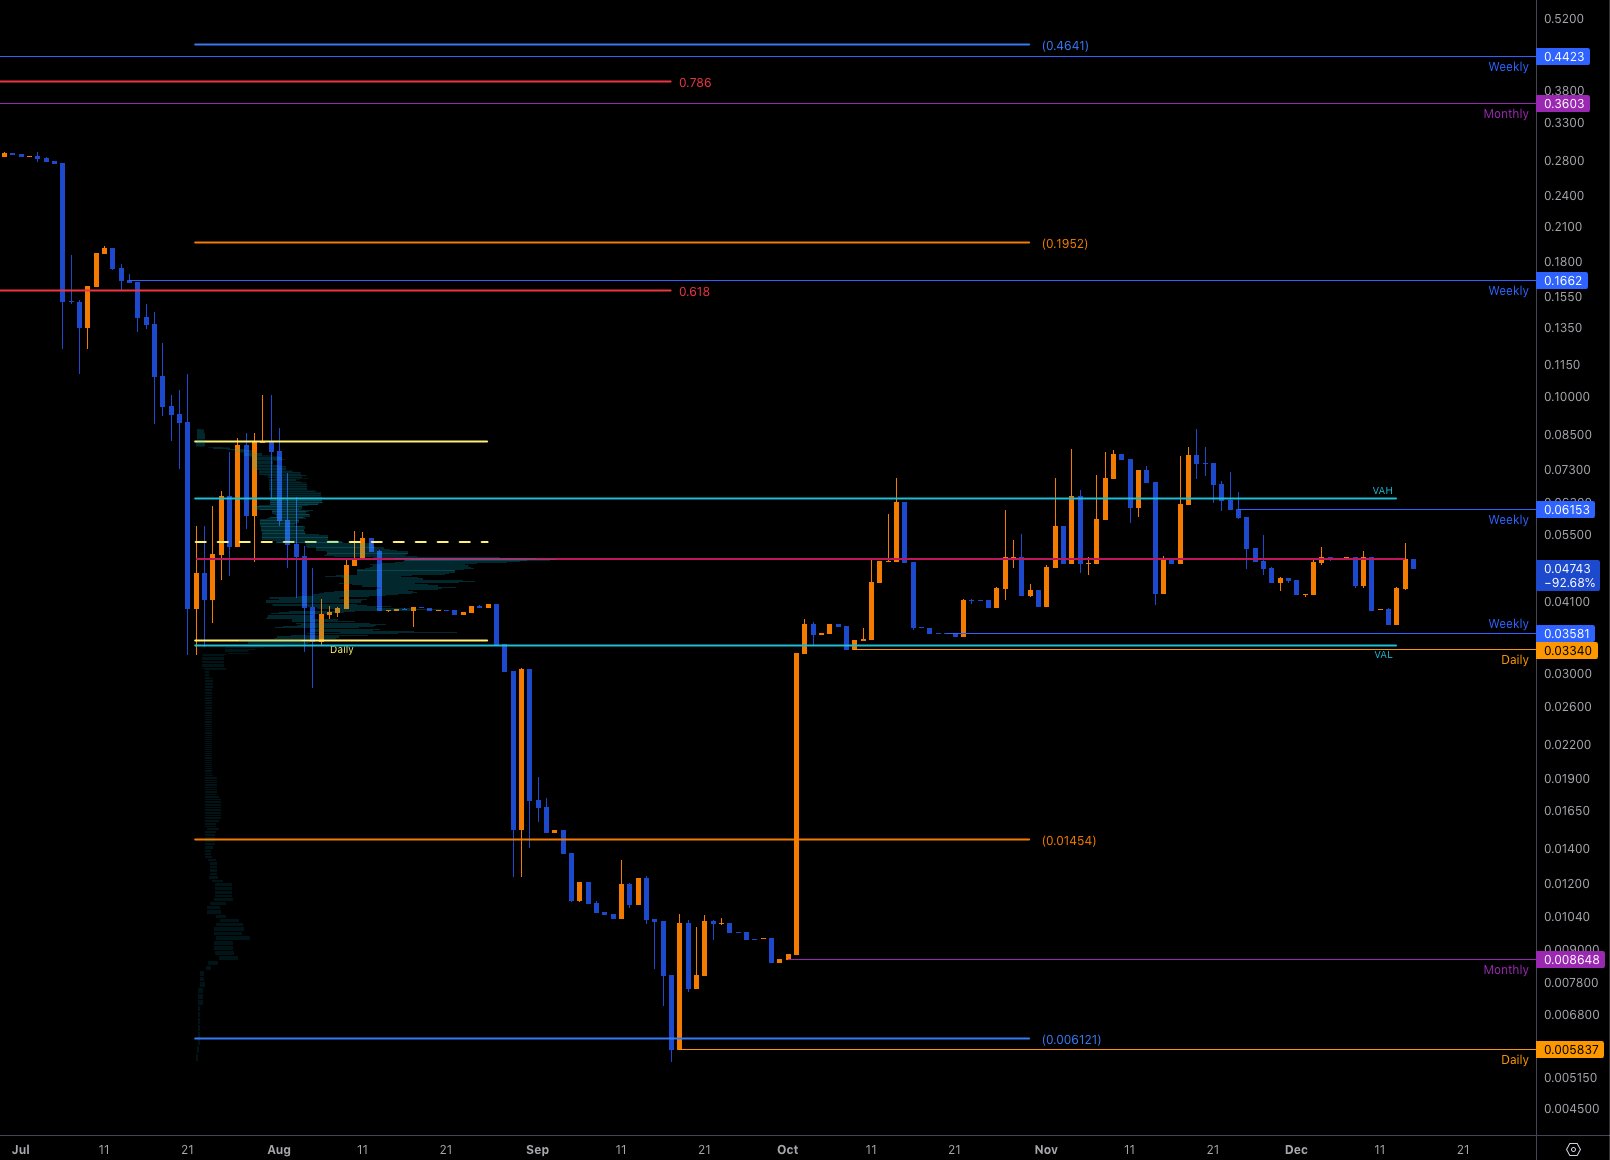
3. More locally we have this old range (mentioned before) which was reclaimed and bottom of the channel is in confluence with VAL/Weekly/Daily. It's a pretty big range (~150%). Another interesting thing is a (potential) symmetry of the Parallel Channel - Price dropped to the blue line at .006121 and if the symmetry happens this could go to the upper blue line at 0.4641, which is close to one of the resistance zones with Monthly/Weekly/.786.
These are pretty big moves so can't happen in a month or two...