🔔The End of an Era: ICON Network Confirms Shutdown Plan and Final @sodaholders Migration Schedule
The crypto landscape is evolving, and so are its pioneers. ICON has officially announced the final timeline for its historic transition to SODAX:
the ICON Network will be permanently halted on December 31, 2026.
https://t.co/vOrofQUpvQ
Comprar cripto
tarjeta
Comercio P2P
Compra USDT en un marketplace
Tarjeta de crédito/débito
Compre criptomonedas con Visa o MasterCard
Pago vía prestadores
Compre criptomonedas a través de MoonPay, Simplex y más
Tarjeta BitMart
Impulsando su experiencia con las criptomonedas
Tarjeta prepago de criptomonedas
Obtenga una Mastercard lista para usar al instante
Comerciar
USDⓈ-M
Utilizando USDⓈ como colateral
COIN-M
Utilizando la propia moneda como colateral
TradFi
Trading integral para metales, acciones y forex
Operativa de demostración
Aprenda a operar con riesgo cero
Resumen de futuros
Plataforma única para todo lo relacionado con futuros
Rey de Futuros
Pool de premios de 478 000 USDT
Crecer
Resumen de Earn
Activos inactivos, gane con facilidad
Ahorros
Gane intereses conservando su portafolio.
Staking
Staking sencillo, cuantiosas retribuciones.
Gestión de patrimonio
Aumente su riqueza con un equipo de activos top
RWA
Mantenga BMRUSD, disfrute del rendimiento
Exclusivo VIP
Gane de forma estable para usuarios VIP
Rewards
Centro de recompensas
Descubra recompensas exclusivas por valor de hasta 14 000 USDT
LaunchPrime
Una plataforma para lanzar tokens y NFT
Programa de afiliados
Únase para ganar cuantiosas comisiones
Powerdrop
¡La solución AirDrop de próxima generación ya está AQUÍ!
Centro de eventos
El centro unificado para todas las operaciones de trading
Sorteo diario de futuros
100 % de probabilidades de ganar con operaciones diarias
Sorteo diario de Spot
Gane 8888 USDT en grandes premios
Recarga móvil
Recargue móviles de forma fácil, online y segura
Send
Send money globally, fast and secure
BitMart Mall
Viva de las criptomonedas

ICON (ICX)
$ 0.019 (ICX/USD)
0.00%
24H
ICON Datos de precios en tiempo real
El precio de hoy de ICON es de $ 0.019 (ICX/USD). Con una capitalización de mercado de $ 21.92M USD. Volumen de trading en 24 horas de $ 1.54M USD, Un cambio de precio en 24 horas de +0.00%. Y un suministro circulante de 1.10B ICX.
ICON ICX Historial de precios USD
Siga el precio de ICON para hoy, 7 días, 30 días y 90 días
Periodo
Cambiar
Cambio (%)
Hoy
$ 0
0.00%
7días
$ 0.0099
-33.33%
30días
$ 0.019
-50.00%
90días
$ 0.019
-50.00%
Sea propietario de ICX ahora
Compra y vende ICX fácil y seguro en BitMart.
ICON Información de mercado
$ 0.019 Autonomía de 24 horas $ 0.019
Máximo histórico
$ 0.059
El mínimo histórico
$ 0.019
Cambio en 24 h
0.00%
Volumen en 24 h
$ 1,539,583.84
Suministros en circulación
1.09B
ICX
Market Cap
$ 21.92M
Suministro máximo
--
Capitalización de mercado totalmente diluida
$ 22.15M
Trade ICX
Ganar
Pon a trabajar tus criptomonedas inactivas y obtén ingresos pasivos a través de ahorros, staking y más.
ICON X Insight

Aalexxx™
Media
Researcher
C
 3.6K @Aaleks_crypt
 Extremadamente bajista
ICON will shut down on December 31, 2026, and holders must migrate to SODA.
 2
2
 0
0
 28
28
2026-05-27 12:38
Tendencia de ICX tras el lanzamiento
Bajista
ICON will shut down on December 31, 2026, and holders must migrate to SODA.

吴说区块链
Media
Educator
D
177.6K @wublockchain12 Extremadamente bajista
ICX will shut down its network on December 31, 2026 and migrate to SODA, outlook bleak
South Korea's veteran public chain ICON announced that it will officially shut down its network on December 31, 2026, and complete the migration to SODAX. The official stated that the final migration deadline from ICX to SODA is also December 31, 2026, after which ICX will no longer be able to migrate. ICON said that as cross-chain and liquidity infrastructure mature, maintaining the Layer 1 no longer aligns with the project's direction. https://t.co/cqZvbnvoT2
2
2
2.9K
2026-05-25 14:56
Tendencia de ICX tras el lanzamiento
Bajista
ICX will shut down its network on December 31, 2026 and migrate to SODA, outlook bleak

Crypto Patel
TA_Analyst
OnChain_Analyst
B
60.9K @CryptoPatel Bajista
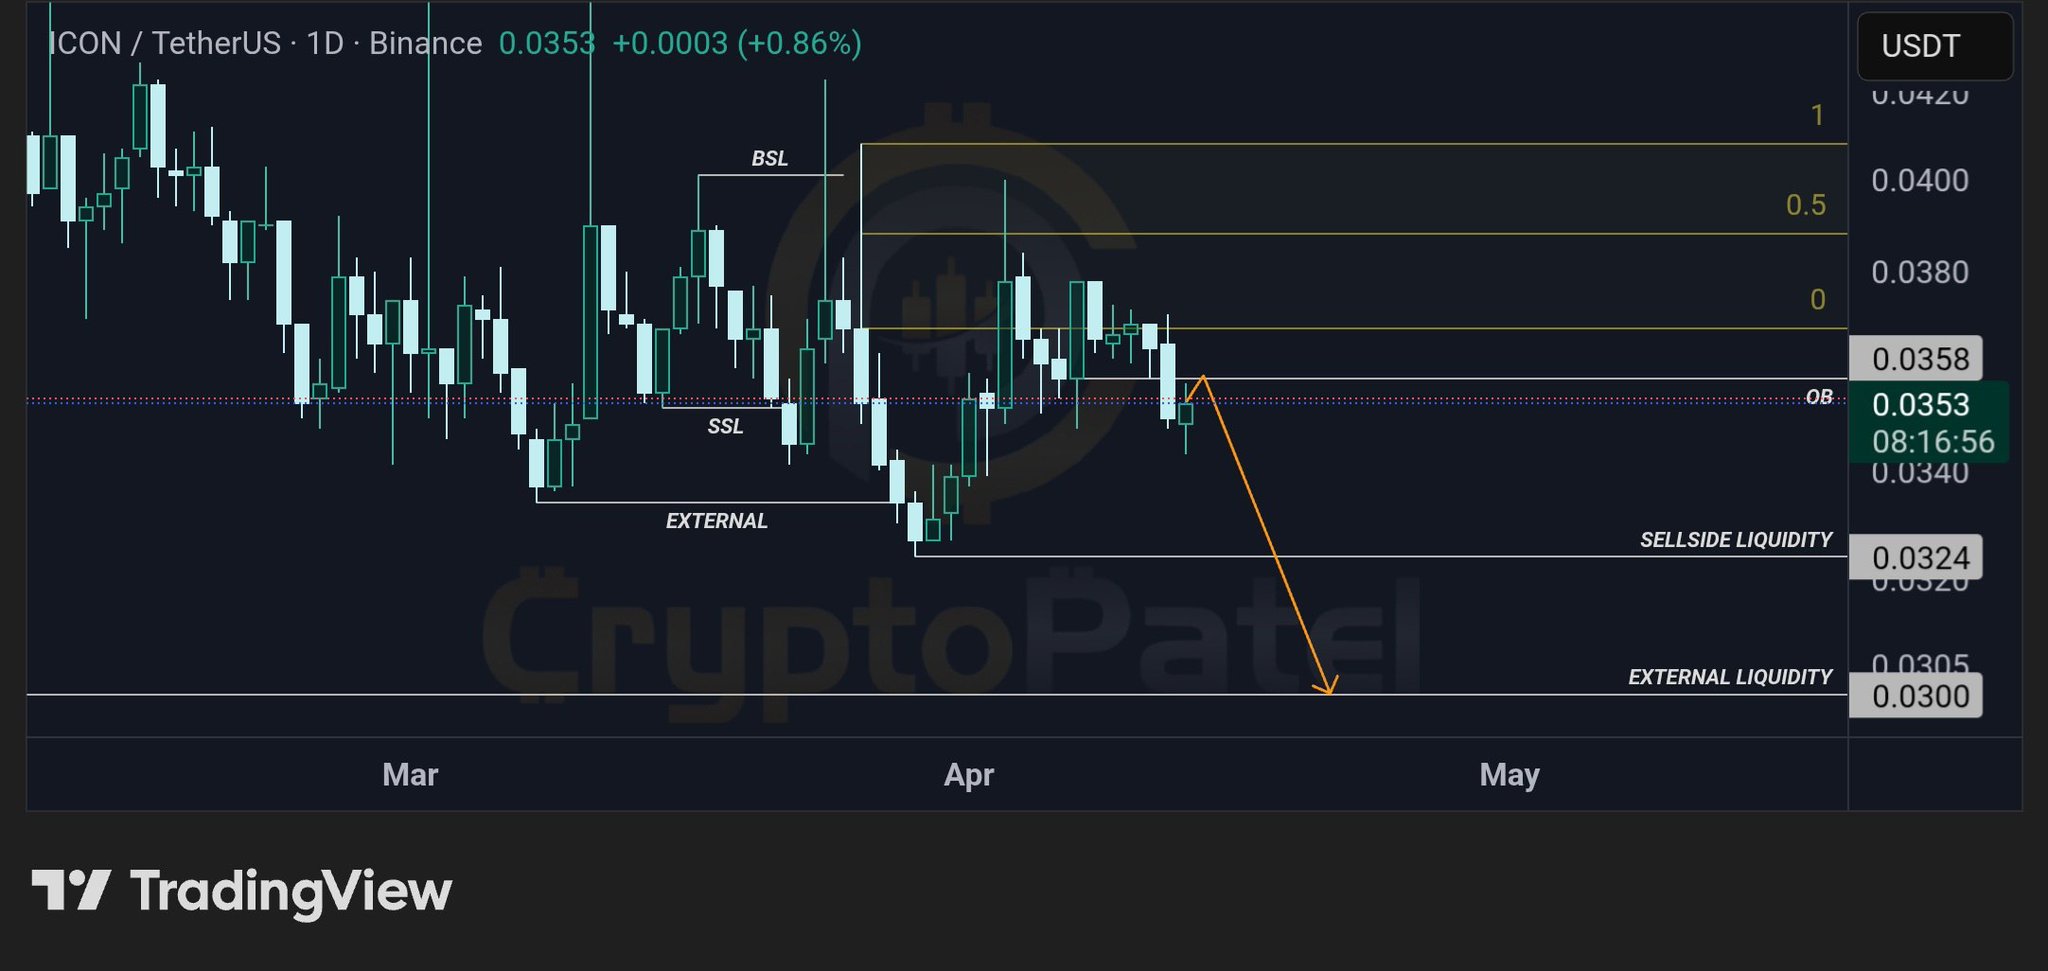
ICX technical outlook shows weakness, expected to continue falling to $0.0324‑$0.0300.
$ICX/USDT 1D SETUP | BEARISH CONTINUATION TOWARD SELL-SIDE LIQUIDITY
#ICX is reacting from a higher timeframe order block in a premium zone, showing weak bullish continuation and signs of distribution, favoring downside continuation toward liquidity below.
Technical Structure:
✅ Daily Order Block → strong resistance in premium zone
✅ Prior rejection → bearish intent confirmed
✅ Weak bullish continuation → distribution behavior
✅ HTF bearish structure forming
✅ Liquidity below → clear downside targets
Targets: $0.0324 → $0.0300
Invalidation: 1D close above $0.0387
Bearish bias. Wait for minor pullback / rejection inside OB and confirmation before entering toward sell-side liquidity.
TA Only. DYOR.
 230
11
5.7K
230
11
5.7K
2026-04-14 05:33
Tendencia de ICX tras el lanzamiento
Extremadamente bajista
ICX technical outlook shows weakness, expected to continue falling to $0.0324‑$0.0300.
Predicción de precios
¿Cuándo es un buen momento para comprar ICX? ¿Debería comprar o vender ICX ahora?
Al decidir si es un buen momento para comprar o vender ICON (ICX), es importante ajustarse primero a su propia estrategia de trading y perfil de riesgo. Los inversores a largo plazo y los traders a corto plazo suelen interpretar las condiciones del mercado de forma diferente, por lo que su decisión debe reflejar su enfoque personal. Según el último análisis técnico de 4 horas de ICX, la señal de trading actual es Hold. Según el último análisis técnico de 1 día de ICX, la señal actual es Hold.

Predicción de Beacon
Pronóstico probabilístico de precios (próximas 24 horas)Descargo de responsabilidad de la predicción de Beacon
Los resultados de los datos que se muestran en esta página se analizan en función de los datos de trading reales (OHLCV) del par de trading seleccionado junto con los indicadores técnicos correspondientes.
Esta predicción es un producto técnico experimental y se proporciona solo con fines de referencia. No constituye un consejo de inversión. Los acontecimientos inesperados del mundo real pueden influir significativamente en el comportamiento del mercado. Por tanto, los traders deben tomar decisiones con precaución.
Esta predicción es un producto técnico experimental y se proporciona solo con fines de referencia. No constituye un consejo de inversión. Los acontecimientos inesperados del mundo real pueden influir significativamente en el comportamiento del mercado. Por tanto, los traders deben tomar decisiones con precaución.
Sobre ICON
ICON (ICX) is a cryptocurrency . ICON has a current supply of 1,108,792,174.2180953 with 1,097,167,983.2979836 in circulation. The last known price of ICON is 0.02462115 USD and is down -1.06 over the last 24 hours. It is currently trading on 168 active market(s) with $681,925.96 traded over the last 24 hours. More information can be found at https://icon.community.
Leer más
Enlaces oficiales
Explorador de blockchain
Explorar más
BM Discovery


Nuevo listado

CNT Centel
-- 0.00%

CRDOON Credo Technology Group Holding Ltd
-- 0.00%

BEON Bloom Energy Corp
-- 0.00%

DASHON DoorDash
-- 0.00%

APPON AppLovin Corporation
-- 0.00%

APLDON Applied Digital
-- 0.00%

NEEON NextEra Energy
-- 0.00%

ONON ON Semiconductor Corporation
-- 0.00%

SCHWON The Charles Schwab Corporation
-- 0.00%

ANSEM The Black Bull
-- 0.00%