Empezar
Escanee para descargar la aplicación
para iOS y Android

Rigetti Computing Tokenized Stock (Robinhood) (RGTI)

$
$ 16.58 (RGTI/USD)
-5.74%
24H

Rigetti Computing Tokenized Stock (Robinhood) Datos de precios en tiempo real

El precio de hoy de Rigetti Computing Tokenized Stock (Robinhood) es de $ 16.58 (RGTI/USD). Con una capitalización de mercado de $ 2,386.32 USD. Volumen de trading en 24 horas de $ 0 USD, Un cambio de precio en 24 horas de -5.74%. Y un suministro circulante de 143.95 RGTI.

Rigetti Computing Tokenized Stock (Robinhood) RGTI Historial de precios USD

Siga el precio de Rigetti Computing Tokenized Stock (Robinhood) para hoy, 7 días, 30 días y 90 días
Periodo
Cambiar
Cambio (%)
Hoy
$ 1.01
-5.74%
7días
$ 1.10
-6.02%
30días
$ 1.31
-7.09%
90días
$ 1.31
-7.09%

Sea propietario de RGTI ahora

Compra y vende RGTI fácil y seguro en BitMart.
Comprar/Vender RGTI ahora
Comprar/Vender {0} ahora
Rigetti Computing Tokenized Stock (Robinhood) Información de mercado
Último precio $ 16.58
$ 16.54 Autonomía de 24 horas $ 17.59
Máximo histórico
‎$ 19.34‎
El mínimo histórico
‎$ 16.54‎
Cambio en 24 h
‎-5.74%‎
Volumen en 24 h
‎$ 0‎
Suministros en circulación
143.95 RGTI
Market Cap
‎$ 2,386.32‎
Suministro máximo
--
Capitalización de mercado totalmente diluida
‎$ 2,386.32‎
Trade RGTI

Ganar

Pon a trabajar tus criptomonedas inactivas y obtén ingresos pasivos a través de ahorros, staking y más.
Pruébelo ahora
Pruébelo ahora

Rigetti Computing Tokenized Stock (Robinhood) X Insight

avatar
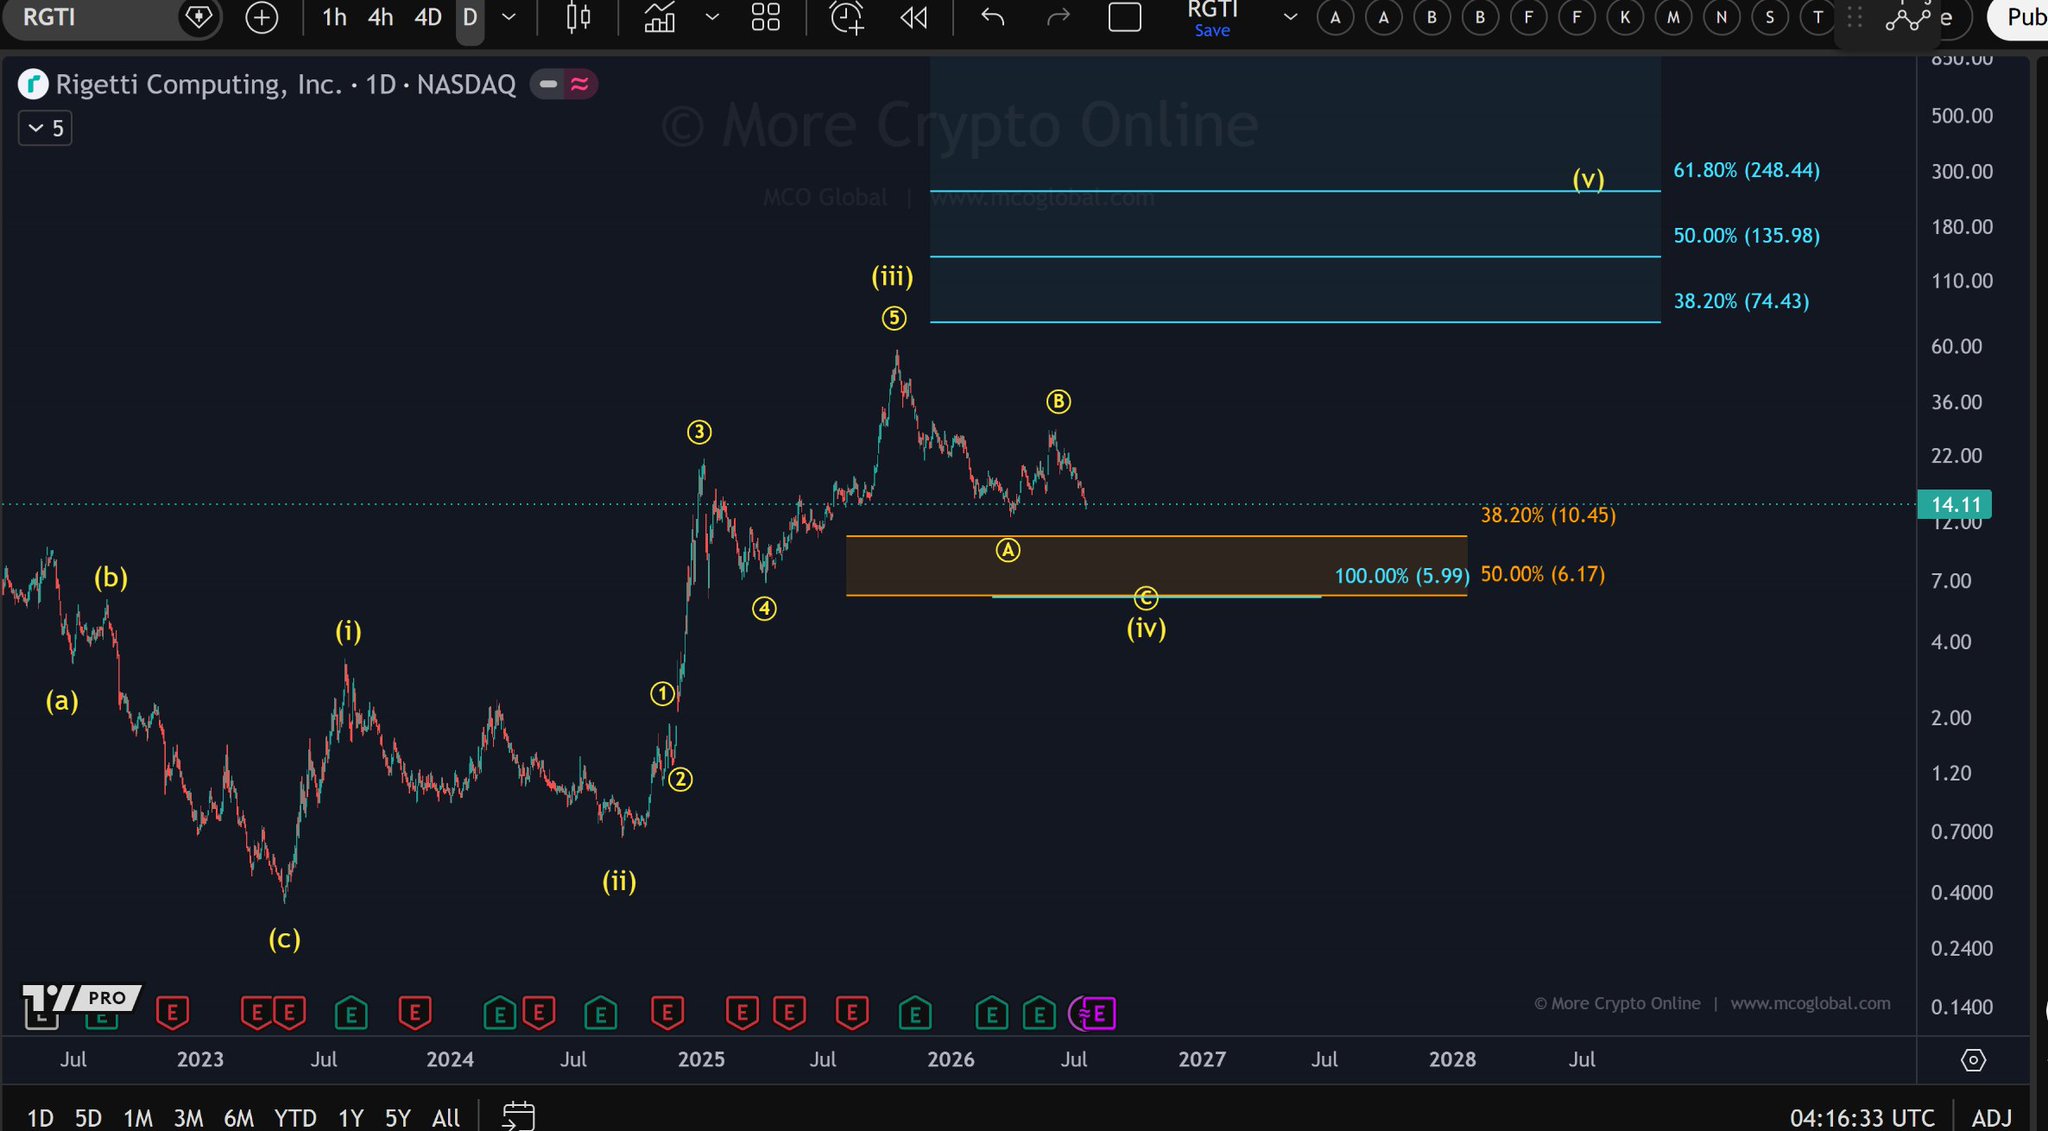
RGTI is in a correction phase, expected to fall to the $5.99-$10.45 support zone.

$RGTI
RGTI remains in a correction phase from the peak of wave (iii), and the move from the peak of wave B still aligns with a still-unfinished decline of wave C.
Leading scenario: The preferred view is that wave (iv) is still incomplete. The decline from the peak of wave B could continue towards the orange support zone between 10,45 $ and 6,17 $, with the 100% C-wave extension around 5,99 $. A move into this area would still fit the structure of the correcting wave (iv) and would not invalidate the count.
Risk scenario: Should the price reverse strongly before reaching the lower support zone and rise back above the recent recovery high, wave (iv) may have completed earlier than expected. On the downside, a sustained break below the 6 $ region would make the correction deeper than ideal and increase the likelihood of a more complex structure.
Key support levels: 10,45 $ / 6,17 $ / 5,99 $ Key resistance levels: 74,43 $ / 136 $ / 248 $ Conclusion: RGTI continues to be viewed as an unfinished (iv) correction wave, with the C-wave decline allowed to extend into the support zone of 10,45 $ to 5,99 $ before a larger (v) wave attempt becomes relevant.
view 22
view 1
view 2.3K
2026-07-18 07:12
Tendencia de RGTI tras el lanzamiento
Bajista
RGTI is in a correction phase, expected to fall to the $5.99-$10.45 support zone.
avatar
RGTI and IONQ gain fresh attention, retail funds shift to quantum AI

🧠 Quantum names $RGTI and $IONQ are pulling fresh attention as retail rotates out of crowded mega-cap AI.

view 7
view 1
view 6.9K
2026-07-07 07:27
Tendencia de RGTI tras el lanzamiento
Alcista
RGTI and IONQ gain fresh attention, retail funds shift to quantum AI
avatar
RGTI is hovering around the $15.30 support level, with a breakout still pending confirmation.

$RGTI
RGTI trades between the next support at $15.30 and the red Fibonacci resistance zone above it. The yellow and blue counts remain fairly balanced, with the proposed wave 1 circle still speculative and should be viewed more as a potential leading diagonal rather than a clear impulse.
Leading scenario: The yellow count can be seen as a possible 1-2 setup, with wave 2 circle still correcting after the rise in May. Holding the area around $15.30 would keep this structure intact, but the next upward attempt needs a stronger reaction before the bullish price gains weight. Risk scenario: Should the $15.30 level give way, the blue ABC interpretation becomes more likely. This would shift focus to the lower red support and possibly the orange support zone, where a C‑wave decline could develop before a larger trend reversal is attempted. Key support levels: $15.30 / ~$12.80 / $10.50–6.20
Key resistance levels: $27.11–49.17
Conclusion: For RGTI there is still no clear advantage between the yellow and blue scenarios. $15.30 is the first level that decides whether the potential 1-2 setup can hold or whether the deeper correction path takes precedence.

view 6
view 1
view 1.8K
2026-07-04 09:12
Tendencia de RGTI tras el lanzamiento
Neutral
RGTI is hovering around the $15.30 support level, with a breakout still pending confirmation.
Detalles

Predicción de precios

¿Cuándo es un buen momento para comprar RGTI? ¿Debería comprar o vender RGTI ahora?

Al decidir si es un buen momento para comprar o vender Rigetti Computing Tokenized Stock (Robinhood) (RGTI), es importante ajustarse primero a su propia estrategia de trading y perfil de riesgo. Los inversores a largo plazo y los traders a corto plazo suelen interpretar las condiciones del mercado de forma diferente, por lo que su decisión debe reflejar su enfoque personal. Según el último análisis técnico de 4 horas de RGTI, la señal de trading actual es Hold.
60
Hold
Análisis técnico de 4 horas de RGTI
Última actualización 2026-08-20 11:59:59
beacon

Predicción de Beacon

Pronóstico probabilístico de precios (próximas 24 horas)
i
Descargo de responsabilidad de la predicción de Beacon
Los resultados de los datos que se muestran en esta página se analizan en función de los datos de trading reales (OHLCV) del par de trading seleccionado junto con los indicadores técnicos correspondientes.
Esta predicción es un producto técnico experimental y se proporciona solo con fines de referencia. No constituye un consejo de inversión. Los acontecimientos inesperados del mundo real pueden influir significativamente en el comportamiento del mercado. Por tanto, los traders deben tomar decisiones con precaución.
Sobre Rigetti Computing Tokenized Stock (Robinhood)
Rigetti Computing Tokenized Stock (Robinhood) (RGTI) is a cryptocurrency and operates on the Robinhood Chain platform. Rigetti Computing Tokenized Stock (Robinhood) has a current supply of 143.953. The last known price of Rigetti Computing Tokenized Stock (Robinhood) is 18.86331123 USD and is up 0.60 over the last 24 hours. It is currently trading on 11 active market(s) with $0.00 traded over the last 24 hours. More information can be found at https://robinhood.com/us/en/.
Leer más