Se lancer
Scanner pour télécharger l'application
iOS et Android
BitMart / Crypto / AMP

Amp (AMP)

$
$ 0.00044 (AMP/USD)
1.13%
24H

Amp Données sur les prix en temps réel

Le prix de Amp aujourd'hui est $ 0.00044 (AMP/USD). Avec une capitalisation boursière de $ 40.18M USD. Volume de trading de $ 99,289.69 USD sur 24 heures, Un changement de prix de +1.13% sur 24 heures, Et une réserve circulante de 89.78B AMP.

Amp AMP Historique des prix USD

Suivez le prix de Amp aujourd’hui, dans 7 jours, 30 jours et 90 jours
Période
Modifier
Variation (en pourcentage)
Aujourd'hui
$ 0.0000049
1.13%
7Jours
$ 0.000029
-6.28%
30Jours
$ 0.00025
-36.00%
90Jours
$ 0.00056
-55.73%

Possédez AMP dès maintenant

Achetez et vendez AMP facilement et en toute sécurité sur BitMart.
Acheter/vendre AMP maintenant
Acheter/vendre {0} maintenant
Amp Informations sur le marché
Dernier prix $ 0.00044
$ 0.00043 Fourchette de prix sur 24 heures $ 0.00045
Record absolu
‎$ 0.022‎
Plus bas niveau jamais atteint
‎$ 0.00043‎
Variation sur 24 heures
‎1.13%‎
Volume sur 24 h
‎$ 99,289.69‎
Approvisionnement en circulation
89.78B AMP
Capitalisation boursière
‎$ 40.18M‎
Approvisionnement maximal
100.00B AMP
Capitalisation boursière entièrement diluée
‎$ 44.76M‎
Trader AMP

Gagner

Faites fructifier vos cryptomonnaies et générez des revenus passifs grâce à l'épargne, au staking, et plus encore.
Essayez maintenant
Essayez maintenant

Amp X Insight

avatar
The descending wedge of AMP is approaching its conclusion, potentially leading to a new trend shift; monitor the B/R combo signal.

ethereum:0xff20817765cb7f73d4bde2e66e067e58d11095c2

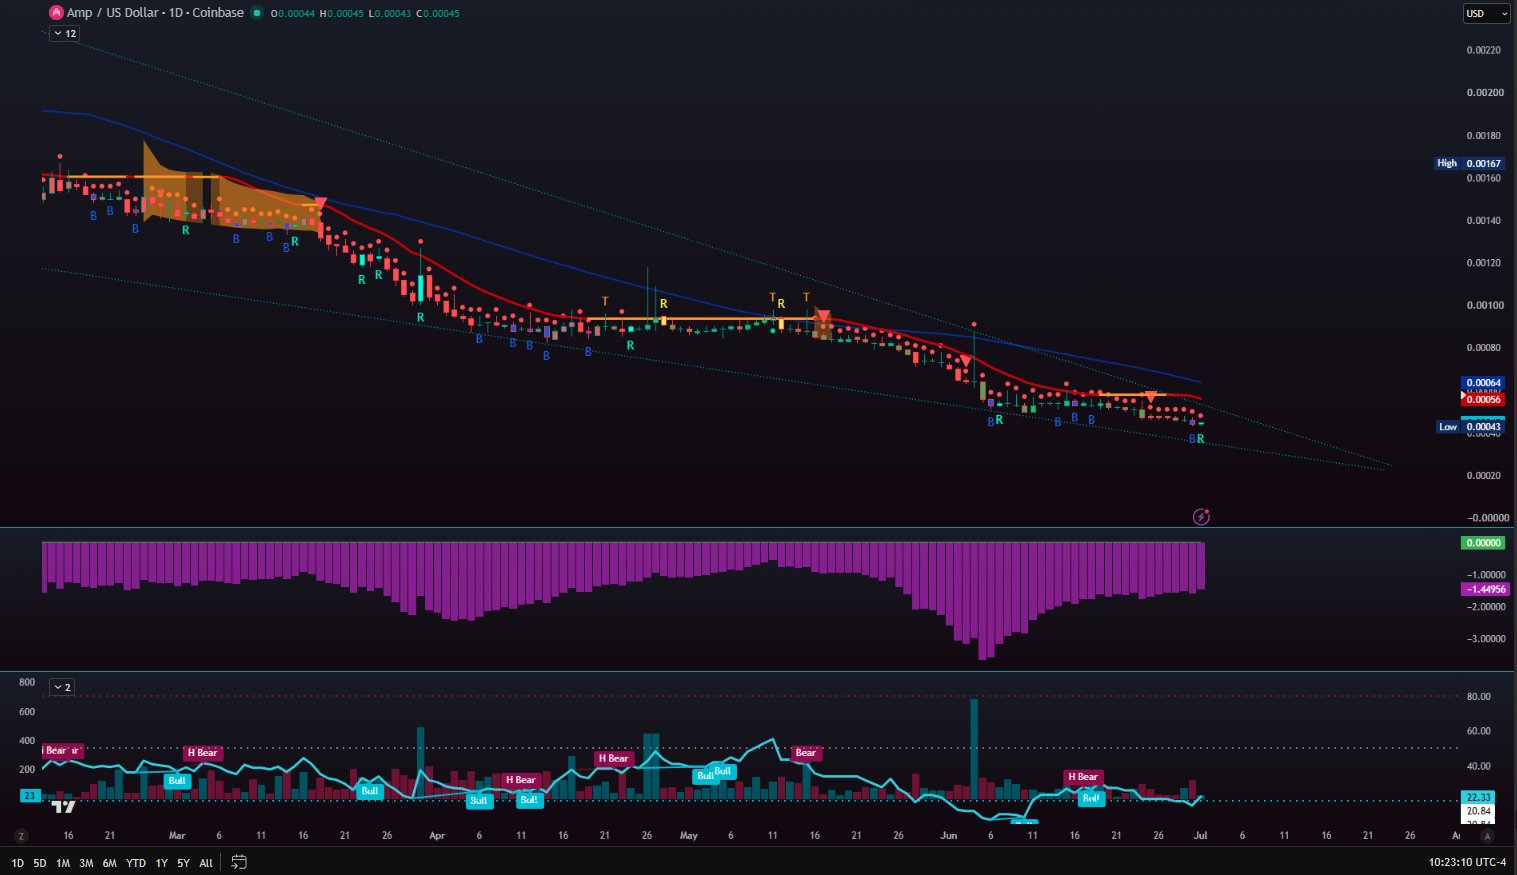
Looks like we'll have a new trend forced into play in the coming weeks ahead. This smaller descending wedge is nearing its end. That does *not* mean that all of a sudden this will catapult to Valhalla; it just means that it'll have to move either above or below this area and will most likely start a new channel/trend. 50DMA is not far above, nor is the track line on the Daily. One thing to note though is this new B/R combo printing. It hasn't stuck quite yet, but something to watch, especially if it's a precursor to the trend shift in the coming weeks.

view 13
view 0
view 300
2026-07-01 15:37
Tendance de AMP après le lancement
Haussier
The descending wedge of AMP is approaching its conclusion, potentially leading to a new trend shift; monitor the B/R combo signal.
avatar
AMP is exploring transaction fairness and PFOF rebate functionality, still pending validation.
avatar

AMP enables transaction fairness, PFOF rebates, and much more. Talk to us if you are interested in exploring serving as a proposer with App-Specific Sequencing and unique order flows.

Note: AMP is exploratory research at this stage until further validation.

view 100
view 10
view 14.9K
2026-06-12 08:27
Tendance de AMP après le lancement
Haussier
AMP is exploring transaction fairness and PFOF rebate functionality, still pending validation.
avatar
AMP has been in a long-term descending wedge pattern, with RSI severely oversold, and we need to watch whether it can break out and form a new trend before the end of July.

$amp

Still the same setup as the last few years: smaller structure inside a larger structure. The key areas to watch for above and below are still the same.

As time goes on, however, this smaller wedge will need to break inside the larger one. By the end of July, this smaller structure will have to break and create a new trend. The RSI has been horrendous and way oversold, but capitulation is what happens when you hit peak bear market levels. All in all, we just have to continue watching the above and below breaking points. This smaller wedge has been here since last January 2025.

view 43
view 5
view 1.7K
2026-06-08 12:57
Tendance de AMP après le lancement
Neutre
AMP has been in a long-term descending wedge pattern, with RSI severely oversold, and we need to watch whether it can break out and form a new trend before the end of July.
Détails

Prévision de prix

Quel est le meilleur moment pour acheter AMP? Dois-je acheter ou vendre AMP maintenant ?

Pour déterminer s'il est opportun d'acheter ou de vendre Amp (AMP), il est important de commencer par s'aligner sur sa propre stratégie de trading et son profil de risque. Les investisseurs à long terme et les traders à court terme interprètent souvent les conditions du marché différemment, votre décision doit donc refléter votre approche personnelle. Selon la dernière analyse technique AMP de 4 heures, le signal de trading actuel est Tenez. Selon la dernière analyse technique AMP sur 1 jour, le signal actuel est Tenez.
54
Tenez
Analyse technique de 4 heures de AMP
Dernière mise à jour 2026-07-01 11:59:59
57
Tenez
Analyse technique sur 1 jour de AMP
Dernière mise à jour 2026-07-02 00:00:00
beacon

Prédiction de Beacon

Prévision probabiliste des prix (Prochaines 24 heures)
i
Avertissement de prédiction de Beacon
Les résultats affichés sur cette page sont analysés sur la base des données de trading réelles (OHLCV) de la paire de trading sélectionnée ainsi que des indicateurs techniques correspondants.
Cette prédiction est un produit technique expérimental et est fournie uniquement à titre de référence. Ceci ne constitue pas un conseil en investissement. Des événements inattendus du monde réel peuvent avoir un impact significatif sur le comportement du marché. Les traders doivent prendre des décisions avec prudence.
À propos Amp
Amp (AMP) is a cryptocurrency launched in 2020and operates on the Ethereum platform. Amp has a current supply of 99,720,238,122.28571238 with 89,781,193,103.18022 in circulation. The last known price of Amp is 0.00045788 USD and is down -2.29 over the last 24 hours. It is currently trading on 188 active market(s) with $1,958,795.15 traded over the last 24 hours. More information can be found at https://amp.xyz.
En savoir plus
Acheter AMP
Trader AMP