🔔The End of an Era: ICON Network Confirms Shutdown Plan and Final @sodaholders Migration Schedule
The crypto landscape is evolving, and so are its pioneers. ICON has officially announced the final timeline for its historic transition to SODAX:
the ICON Network will be permanently halted on December 31, 2026.
https://t.co/vOrofQUpvQ
Acheter des cryptomonnaies
carte
P2P Trading
Achetez des USDT sur la marketplace
Carte bancaire
Achetez des cryptomonnaies avec une carte Visa ou Mastercard
Paiement par un tiers
Buy des crypto via MoonPay, Simplex et plus
BitMart Card
Dynamisez vos investissements dans les cryptos
Carte prépayée crypto
Obtenez instantanément une Mastercard prête à l'emploi
Échanger
Spot
Négociez des cryptomonnaies rapidement et de manière professionnelle
BM Discovery
La plateforme de découverte d'actifs On-Chain la plus rapide
DEX
bêta
La solution la plus simple pour trader en chaîne.
Marge
5x
Augmentez vos profits grâce à l'effet de levier
Pré-marché
Planifiez à l'avance, saisissez l'opportunité
USDⓈ-M
En utilisant USDⓈ comme garantie
COIN-M
Utiliser la cryptomonnaie elle-même comme garantie
TradFi
Un guichet unique pour les métaux, les actions et le forex
Démo de trading
Apprenez à trade sans risque
Aperçu des contrats à terme
Une plateforme unique pour tout ce qui concerne les contrats à terme
Futures King
Cagnotte de 478 000 USDT
Augmenter
Aperçu des gains
Actifs inactifs, obtenez des rendements en toute simplicité
Épargne
Gagnez des intérêts grâce à vos avoirs.
Staking
Staking facile, récompenses élevées
Gestion de patrimoine
Développez votre patrimoine avec une équipe d'actifs de premier ordre Top
RWA
Conservez le BMRUSD et profitez du rendement
Offre exclusive pour les VIP
Gagner en toute sécurité pour les utilisateurs VIP
Rewards
Centre de récompenses
Découvrez des récompenses exclusives d'une valeur allant jusqu'à 14 000 USDT
Lancement Prime
Une plateforme de lancement de jetons et NFT
Programme d'affiliation
Rejoignez-nous pour profiter de commissions élevées
Powerdrop
La solution airdrop de nouvelle génération est DISPONIBLE !
Centre des événements
Le guichet unique pour toutes les opérations commerciales
Tirage au sort quotidien futures
100% de chances de gagner avec les tradings quotidiens
Tirage quotidien Spot
Gagnez 8 888 USDT en grands prix
Staker pour voter
Gagnez des airdrops en votant
Institution
Des services professionnels et exclusifs
VIP
Débloquez des récompenses exclusives
Académie
Tout ce que vous devez savoir sur le trading et la blockchain.
Stage chez BitMart
Commencez votre carrière en crypto ici
Bitmart Travel
Services de voyage mondiaux One-Stop
INO
Une plateforme de lancement de NFT
Stake BMX pour le listing
Partager les frais de transaction
APIS
Une stabilité fiable et de nombreux points de terminaison
Programme de courtier
Gagnez des commissions grâce à l'intégration d'API
Actualités
Dernières actualités et derniers points de vue
MARKETPLACE NFT
Une marketplace NFT unique en son genre
Recharge mobile Top
Rechargez vos téléphones portables facilement, online, en toute sécurité
Send
Send money globally, fast and secure
BitMart Mall
Événement en direct sur les cryptomonnaies

ICON (ICX)
$ 0.019 (ICX/USD)
0.00%
24H
ICON Données sur les prix en temps réel
Le prix de ICON aujourd'hui est $ 0.019 (ICX/USD). Avec une capitalisation boursière de $ 21.92M USD. Volume de trading de $ 1.54M USD sur 24 heures, Un changement de prix de +0.00% sur 24 heures, Et une réserve circulante de 1.10B ICX.
ICON ICX Historique des prix USD
Suivez le prix de ICON aujourd’hui, dans 7 jours, 30 jours et 90 jours
Période
Modifier
Variation (en pourcentage)
Aujourd'hui
$ 0
0.00%
7Jours
$ 0.0099
-33.33%
30Jours
$ 0.019
-50.00%
90Jours
$ 0.019
-50.00%
Possédez ICX dès maintenant
Achetez et vendez ICX facilement et en toute sécurité sur BitMart.
ICON Informations sur le marché
$ 0.019 Fourchette de prix sur 24 heures $ 0.019
Record absolu
$ 0.059
Plus bas niveau jamais atteint
$ 0.019
Variation sur 24 heures
0.00%
Volume sur 24 h
$ 1,539,583.84
Approvisionnement en circulation
1.09B
ICX
Capitalisation boursière
$ 21.92M
Approvisionnement maximal
--
Capitalisation boursière entièrement diluée
$ 22.15M
Trader ICX
Gagner
Faites fructifier vos cryptomonnaies et générez des revenus passifs grâce à l'épargne, au staking, et plus encore.
ICON X Insight

Aalexxx™
Media
Researcher
C
 3.6K @Aaleks_crypt
 Extrêmement baissier
ICON will shut down on December 31, 2026, and holders must migrate to SODA.
 2
2
 0
0
 28
28
2026-05-27 12:38
Tendance de ICX après le lancement
Baissier
ICON will shut down on December 31, 2026, and holders must migrate to SODA.

吴说区块链
Media
Educator
D
177.6K @wublockchain12 Extrêmement baissier
ICX will shut down its network on December 31, 2026 and migrate to SODA, outlook bleak
South Korea's veteran public chain ICON announced that it will officially shut down its network on December 31, 2026, and complete the migration to SODAX. The official stated that the final migration deadline from ICX to SODA is also December 31, 2026, after which ICX will no longer be able to migrate. ICON said that as cross-chain and liquidity infrastructure mature, maintaining the Layer 1 no longer aligns with the project's direction. https://t.co/cqZvbnvoT2
2
2
2.9K
2026-05-25 14:56
Tendance de ICX après le lancement
Baissier
ICX will shut down its network on December 31, 2026 and migrate to SODA, outlook bleak

Crypto Patel
TA_Analyst
OnChain_Analyst
B
60.9K @CryptoPatel Baissier
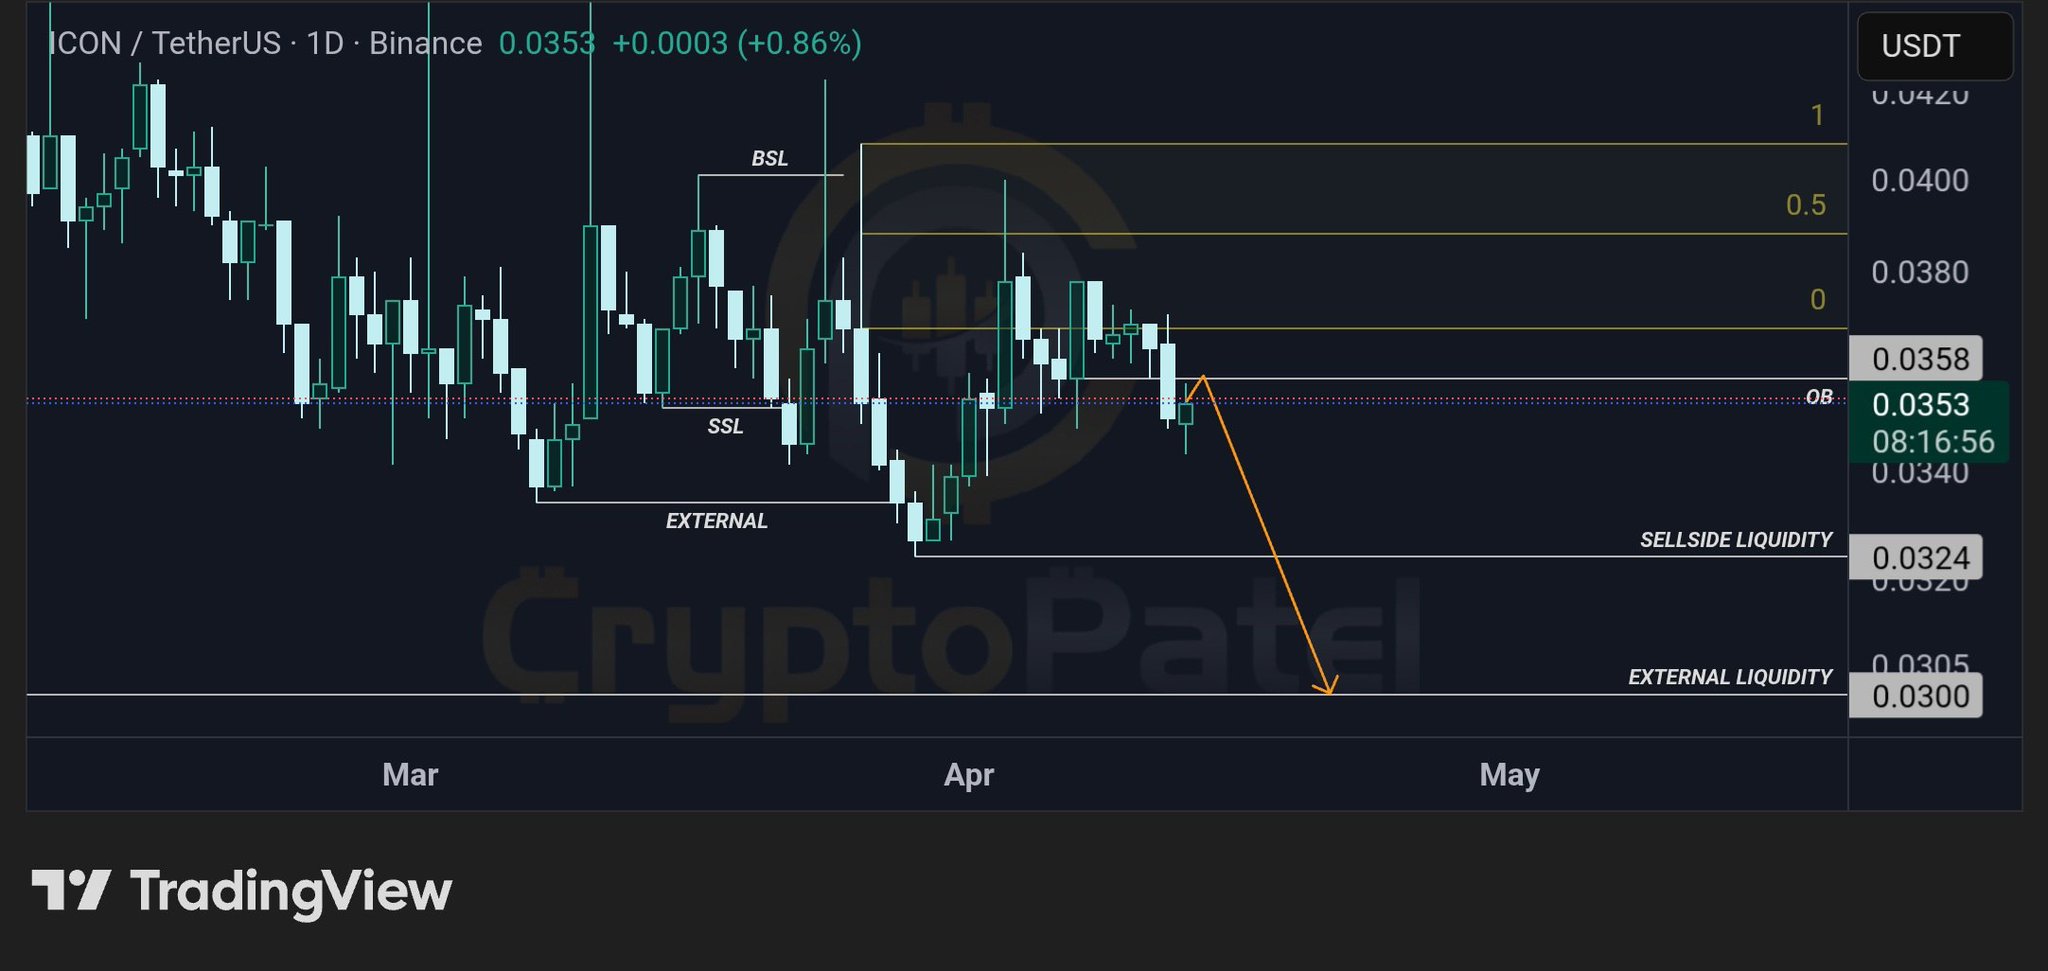
ICX technical outlook shows weakness, expected to continue falling to $0.0324‑$0.0300.
$ICX/USDT 1D SETUP | BEARISH CONTINUATION TOWARD SELL-SIDE LIQUIDITY
#ICX is reacting from a higher timeframe order block in a premium zone, showing weak bullish continuation and signs of distribution, favoring downside continuation toward liquidity below.
Technical Structure:
✅ Daily Order Block → strong resistance in premium zone
✅ Prior rejection → bearish intent confirmed
✅ Weak bullish continuation → distribution behavior
✅ HTF bearish structure forming
✅ Liquidity below → clear downside targets
Targets: $0.0324 → $0.0300
Invalidation: 1D close above $0.0387
Bearish bias. Wait for minor pullback / rejection inside OB and confirmation before entering toward sell-side liquidity.
TA Only. DYOR.
 230
11
5.7K
230
11
5.7K
2026-04-14 05:33
Tendance de ICX après le lancement
Extrêmement baissier
ICX technical outlook shows weakness, expected to continue falling to $0.0324‑$0.0300.
Prévision de prix
Quel est le meilleur moment pour acheter ICX? Dois-je acheter ou vendre ICX maintenant ?
Pour déterminer s'il est opportun d'acheter ou de vendre ICON (ICX), il est important de commencer par s'aligner sur sa propre stratégie de trading et son profil de risque. Les investisseurs à long terme et les traders à court terme interprètent souvent les conditions du marché différemment, votre décision doit donc refléter votre approche personnelle. Selon la dernière analyse technique ICX de 4 heures, le signal de trading actuel est Tenez. Selon la dernière analyse technique ICX sur 1 jour, le signal actuel est Tenez.

Prédiction de Beacon
Prévision probabiliste des prix (Prochaines 24 heures)Avertissement de prédiction de Beacon
Les résultats affichés sur cette page sont analysés sur la base des données de trading réelles (OHLCV) de la paire de trading sélectionnée ainsi que des indicateurs techniques correspondants.
Cette prédiction est un produit technique expérimental et est fournie uniquement à titre de référence. Ceci ne constitue pas un conseil en investissement. Des événements inattendus du monde réel peuvent avoir un impact significatif sur le comportement du marché. Les traders doivent prendre des décisions avec prudence.
Cette prédiction est un produit technique expérimental et est fournie uniquement à titre de référence. Ceci ne constitue pas un conseil en investissement. Des événements inattendus du monde réel peuvent avoir un impact significatif sur le comportement du marché. Les traders doivent prendre des décisions avec prudence.
À propos ICON
ICON (ICX) is a cryptocurrency . ICON has a current supply of 1,108,792,174.2180953 with 1,097,167,983.2979836 in circulation. The last known price of ICON is 0.02462115 USD and is down -1.06 over the last 24 hours. It is currently trading on 168 active market(s) with $681,925.96 traded over the last 24 hours. More information can be found at https://icon.community.
En savoir plus
Liens officiels
Chain Explorer
En savoir plus
BM Discovery


Nouvelle annonce

CNT Centel
-- 0.00%

CRDOON Credo Technology Group Holding Ltd
-- 0.00%

BEON Bloom Energy Corp
-- 0.00%

DASHON DoorDash
-- 0.00%

APPON AppLovin Corporation
-- 0.00%

APLDON Applied Digital
-- 0.00%

NEEON NextEra Energy
-- 0.00%

ONON ON Semiconductor Corporation
-- 0.00%

SCHWON The Charles Schwab Corporation
-- 0.00%

ANSEM The Black Bull
-- 0.00%