가입하기
스캔하여 앱 다운로드
iOS 및 안드로이드

Amp (AMP)

$
$ 0.00044 (AMP/USD)
1.13%
24H

Amp Live Price data

Today's price of Amp Is $ 0.00044 (AMP/USD). With A Market Cap Of $ 40.27M USD. 24-Hour Trading Volume Of $ 99,255.91 USD, A 24-Hour Price Change Of +1.13%, And A Circulating Supply Of 89.78B AMP.

Amp AMP Price History USD

Track the price of Amp for today, 7 days, 30 days and 90 days
기간
변경하기
Change (%)
오늘
$ 0.0000049
1.13%
7일
$ 0.000029
-6.28%
30일
$ 0.00025
-36.00%
90일
$ 0.00056
-55.73%

Own AMP Now

Buy and sell AMP easily and securely on BitMart.
Buy/Sell AMP Now
Buy/Sell {0} Now
Amp Market Information
가격 $ 0.00044
$ 0.00043 24h Range $ 0.00045
All time high
‎$ 0.022‎
All time low
‎$ 0.00043‎
24시간 변동률
‎1.13%‎
24시간 거래량
‎$ 99,255.91‎
유통량
89.78B AMP
Market cap
‎$ 40.27M‎
Max supply
100.00B AMP
Fully diluted market cap
‎$ 44.86M‎
거래하기 AMP

Earn

잔존 암호화폐를 활용하여 저축, 스테이킹 등을 통해 수동 소득을 얻으세요.
지금 사용해 보기
지금 사용해 보기

Amp X 인사이트

avatar
AMP 하락 웨지는 막바지에 다다르고 있으며, 새로운 추세 전환이 올 수 있으니 B/R 조합 신호를 주시해야 합니다.

ethereum:0xff20817765cb7f73d4bde2e66e067e58d11095c2

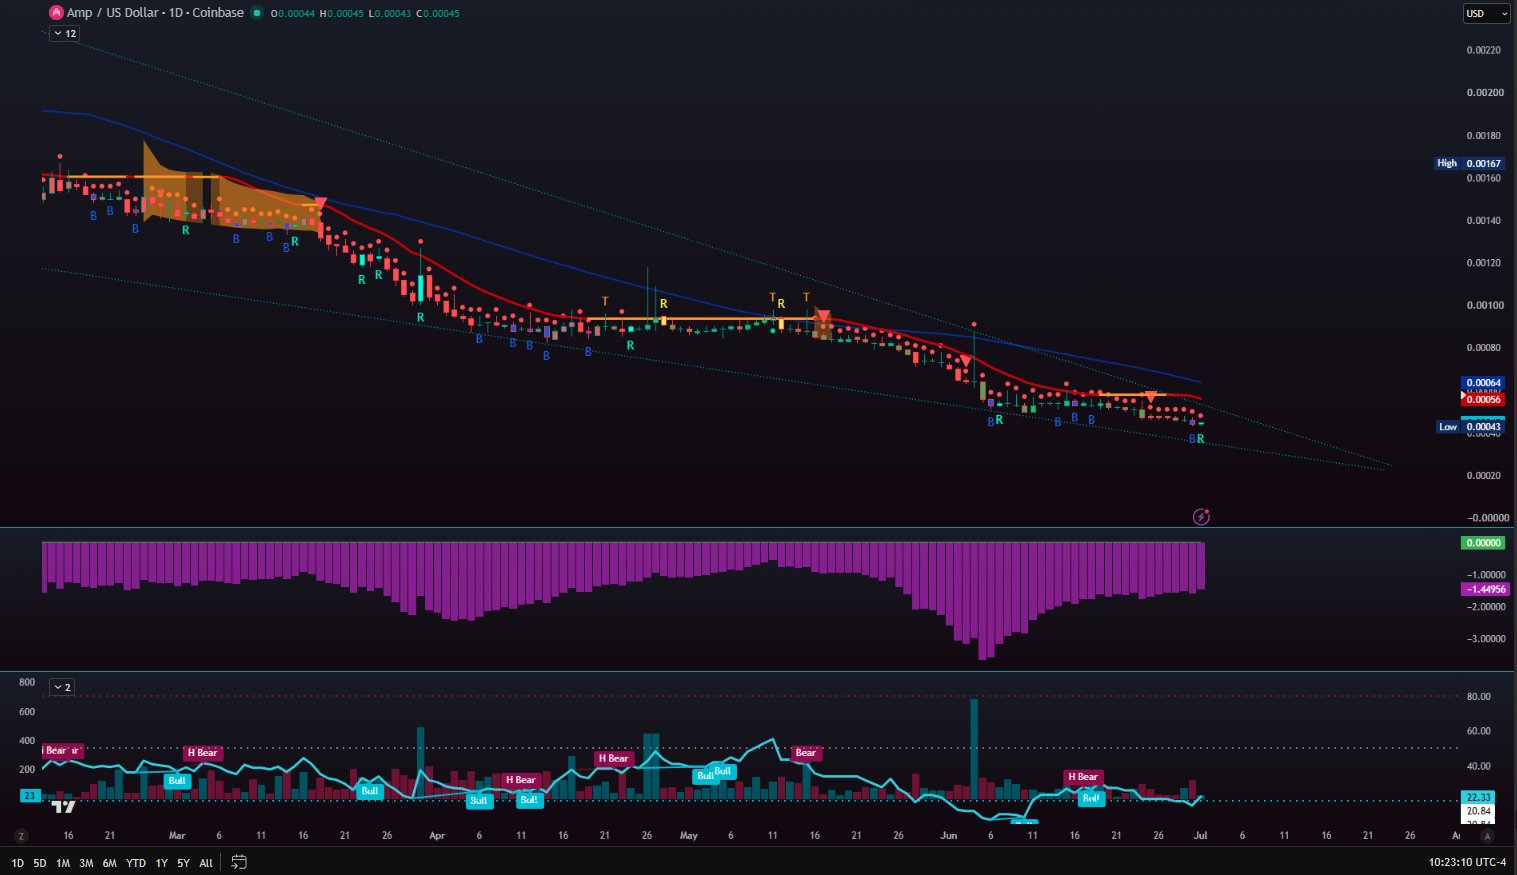
앞으로 몇 주 안에 새로운 추세가 강제로 진행될 것처럼 보입니다. 이 작은 하락 웨지가 곧 끝에 다다르고 있습니다. 이것이 갑자기 발할라로 급상승한다는 뜻은 아니며, 이 영역 위나 아래로 움직여 새로운 채널/추세를 시작하게 될 가능성이 높습니다. 50일 이동 평균은 크게 위에 있지 않으며, 일봉 차트의 트랙 라인도 마찬가지입니다. 다만 주목할 점은 새로운 B/R 조합이 나타나고 있다는 것입니다. 아직 완전히 자리 잡지는 않았지만, 특히 향후 몇 주 내 추세 전환의 전조일 경우 주의 깊게 지켜볼 필요가 있습니다.

view 13
view 0
view 300
2026-07-01 15:37
AMP의 출시 후 추세
상승세
AMP 하락 웨지는 막바지에 다다르고 있으며, 새로운 추세 전환이 올 수 있으니 B/R 조합 신호를 주시해야 합니다.
avatar
AMP는 거래 공정성 및 PFOF 리베이트 기능을 탐색 중이며, 아직 검증 단계에 있습니다.
avatar

AMP는 거래 공정성, PFOF 리베이트 및 그 외 다양한 기능을 제공합니다. App-Specific Sequencing 및 고유 주문 흐름을 통해 제안자 역할을 탐색하고 싶다면 저희에게 연락 주세요.

참고: AMP는 현재 탐색 연구 단계이며 추가 검증이 필요합니다.

view 100
view 10
view 14.9K
2026-06-12 08:27
AMP의 출시 후 추세
상승세
AMP는 거래 공정성 및 PFOF 리베이트 기능을 탐색 중이며, 아직 검증 단계에 있습니다.
avatar
AMP는 장기 하락 쐐기 형태에 있으며, RSI가 심하게 과매도 상태이며, 7월 말까지 돌파가 이루어져 새로운 추세를 형성할 수 있는지 주시해야 합니다.

$amp

지난 몇 년과 동일한 구성을 유지하고 있습니다: 더 큰 구조 내부에 작은 구조가 있습니다. 위와 아래에서 주시해야 할 핵심 영역은 여전히 동일합니다.

하지만 시간이 지나면서 이 작은 쐐기는 더 큰 쐐기 내부에서 돌파해야 합니다. 7월 말까지 이 작은 구조는 돌파하여 새로운 추세를 만들게 됩니다. RSI는 매우 나쁘고 과매도 상태였지만, 최고 하락장 단계에 도달하면 항복이 일어납니다. 전반적으로 우리는 위와 아래의 돌파 지점을 계속 관찰해야 합니다. 이 작은 쐐기는 2025년 1월부터 존재하고 있습니다.

view 43
view 5
view 1.7K
2026-06-08 12:57
AMP의 출시 후 추세
중립
AMP는 장기 하락 쐐기 형태에 있으며, RSI가 심하게 과매도 상태이며, 7월 말까지 돌파가 이루어져 새로운 추세를 형성할 수 있는지 주시해야 합니다.
세부 정보

가격 예측

When is a good time to buy AMP? Should I buy or sell AMP now?

When deciding whether it’s a good time to buy or sell Amp (AMP), it’s important to first align with your own trading strategy and risk profile.Long-term investors and short-term traders often interpret market conditions differently, so your decision should reflect your personal approach. According to the latest AMP 4-hour technical analysis, the current trading signal is Hold. According to the latest AMP 1-day technical analysis, the current signal is Hold.
54
Hold
4-hour technical analysis of AMP
Last Update 2026-07-01 11:59:59
57
Hold
1-day technical analysis of AMP
Last Update 2026-07-02 00:00:00
beacon

Beacon Prediction

Probabilistic Price Forecast (Next 24 Hours)
i
Beacon Prediction Disclaimer
The data results displayed on this page are analyzed based on actual trading data (OHLCV) of the selected trading pair along with corresponding technical indicators.
This prediction is an experimental technical product and is provided for reference purposes only. It does not constitute investment advice. Unexpected real-world events may significantly impact market behavior. Traders should make decisions with caution.
소개 Amp
Amp (AMP) is a cryptocurrency launched in 2020and operates on the Ethereum platform. Amp has a current supply of 99,720,238,122.28571238 with 89,781,193,103.18022 in circulation. The last known price of Amp is 0.00045788 USD and is down -2.29 over the last 24 hours. It is currently trading on 188 active market(s) with $1,958,795.15 traded over the last 24 hours. More information can be found at https://amp.xyz.
자세히 읽어보기
매수 AMP
거래하기 AMP