가입하기
스캔하여 앱 다운로드
iOS 및 안드로이드

The Graph (GRT)

$
$ 0.017 (GRT/USD)
-2.16%
24H

The Graph Live Price data

Today's price of The Graph Is $ 0.017 (GRT/USD). With A Market Cap Of $ 192.06M USD. 24-Hour Trading Volume Of $ 687.55K USD, A 24-Hour Price Change Of -2.31%, And A Circulating Supply Of 10.88B GRT.

The Graph GRT Price History USD

Track the price of The Graph for today, 7 days, 30 days and 90 days
기간
변경하기
Change (%)
오늘
$ 0.00038
-2.16%
7일
$ 0.0014
-7.51%
30일
$ 0.0082
-31.91%
90일
$ 0.0057
-24.48%

Own GRT Now

Buy and sell GRT easily and securely on BitMart.
Buy/Sell GRT Now
Buy/Sell {0} Now
The Graph Market Information
가격 $ 0.017
$ 0.017 24h Range $ 0.018
All time high
‎$ 2.88‎
All time low
‎$ 0.00098‎
24시간 변동률
‎-2.31%‎
24시간 거래량
‎$ 687,554.61‎
유통량
10.87B GRT
Market cap
‎$ 192.06M‎
Max supply
--
Fully diluted market cap
‎$ 204.38M‎
거래하기 GRT

Earn

잔존 암호화폐를 활용하여 저축, 스테이킹 등을 통해 수동 소득을 얻으세요.
지금 사용해 보기
지금 사용해 보기

The Graph X 인사이트

avatar
GRT가 극도로 과매도 상태이며, 차트는 바닥에서 큰 반등을 예측합니다.

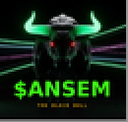
극도로 과매도 수준으로 돌아왔습니다......

ethereum:0xc944e90c64b2c07662a292be6244bdf05cda44a7 https://t.co/gZLfsMd7Rl

view 0
view 0
view 126
2026-06-28 20:12
GRT의 출시 후 추세
상승세
GRT가 극도로 과매도 상태이며, 차트는 바닥에서 큰 반등을 예측합니다.
avatar
ZKVProtocol은 Remix AI 훈련 캠프를 홍보하며, 검증 가능한 AI와 영지식 기술을 논의하고, 다수 프로젝트가 참여합니다.

AI 에이전트가 빠르게 움직이고 있어요💨

이제 질문은 간단합니다: 그들의 행동을 어떻게 검증할까요?

zkVerify가 6월 25일 @EthereumRemix AI Bootcamp에서 다음으로 진행됩니다. 구축자를 위한 검증 가능한 AI와 영지식 인프라를 다룹니다.

놓치지 마세요↴

avatar

@EthereumRemix AI Bootcamp이 진행 중입니다—하지만 아직도 참여할 수 있어요!

@graphprotocol, @ZKVProtocol, @chainlink, @base 및 @ensdomains와 함께하는 5주 과정. 실제 워크숍, 실제 빌드.

지난 세션 (시청 가능):
- Remix 소개: AI로 실제 dApp 구축
- Base: 고급 에이전시 결제 흐름을 위한 스마트 계약
- Chainlink × 헬스케어 및 실제 데이터용 다이나믹 오라클

다음 세션:
- zkVerify: 검증 가능한 AI 및 영지식 인프라 - 6월 25일
- ENS: 주권 아이덴티티 및 인간 친화 인프라 - 6월 29일
- The Graph: 실제 및 임상 데이터에 대한 검증 가능한 인덱싱 - 7월 1일

놓치지 마세요 ↓

view 18
view 0
view 1.9K
2026-06-23 19:37
GRT의 출시 후 추세
상승세
ZKVProtocol은 Remix AI 훈련 캠프를 홍보하며, 검증 가능한 AI와 영지식 기술을 논의하고, 다수 프로젝트가 참여합니다.
avatar
GRT는 Elliott Wave 이론에 기반해 4번째 파동 상승이 예상되며, 현물 매수를 권장합니다.

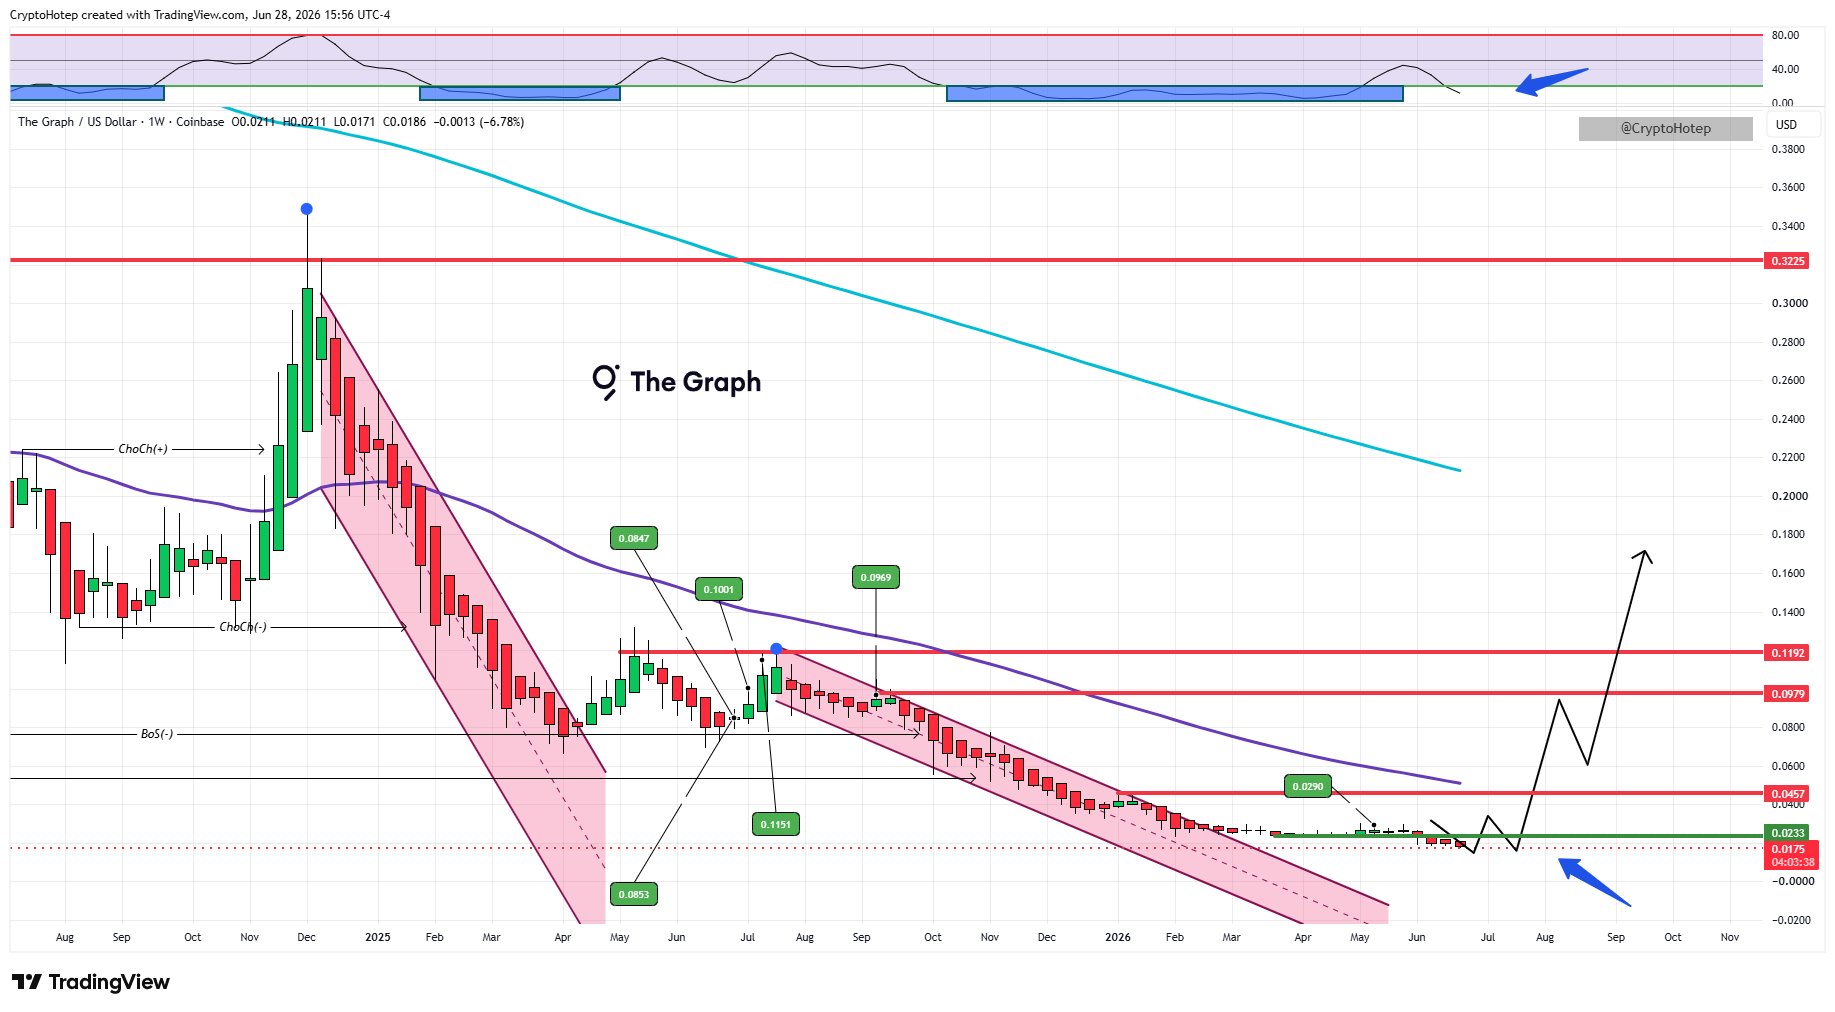
현물 롱 $GRT를 이 4번째 파동에 대해 진행하세요 https://t.co/AviCFhCENU

view 12
view 1
view 1.9K
2026-06-19 13:37
GRT의 출시 후 추세
상승세
GRT는 Elliott Wave 이론에 기반해 4번째 파동 상승이 예상되며, 현물 매수를 권장합니다.
세부 정보

가격 예측

When is a good time to buy GRT? Should I buy or sell GRT now?

When deciding whether it’s a good time to buy or sell The Graph (GRT), it’s important to first align with your own trading strategy and risk profile.Long-term investors and short-term traders often interpret market conditions differently, so your decision should reflect your personal approach. According to the latest GRT 4-hour technical analysis, the current trading signal is Hold. According to the latest GRT 1-day technical analysis, the current signal is Hold.
57
Hold
4-hour technical analysis of GRT
Last Update 2026-07-01 03:59:59
53
Hold
1-day technical analysis of GRT
Last Update 2026-07-02 00:00:00
beacon

Beacon Prediction

Probabilistic Price Forecast (Next 24 Hours)
i
Beacon Prediction Disclaimer
The data results displayed on this page are analyzed based on actual trading data (OHLCV) of the selected trading pair along with corresponding technical indicators.
This prediction is an experimental technical product and is provided for reference purposes only. It does not constitute investment advice. Unexpected real-world events may significantly impact market behavior. Traders should make decisions with caution.
소개 The Graph
The Graph (GRT) is a cryptocurrency launched in 2018and operates on the Ethereum platform. The Graph has a current supply of 11,574,475,335.466496 with 10,876,967,002.13337 in circulation. The last known price of The Graph is 0.01760378 USD and is up 0.00 over the last 24 hours. It is currently trading on 620 active market(s) with $15,859,259.02 traded over the last 24 hours. More information can be found at https://thegraph.com.
자세히 읽어보기
매수 GRT
거래하기 GRT