🔔The End of an Era: ICON Network Confirms Shutdown Plan and Final @sodaholders Migration Schedule
The crypto landscape is evolving, and so are its pioneers. ICON has officially announced the final timeline for its historic transition to SODAX:
the ICON Network will be permanently halted on December 31, 2026.
https://t.co/vOrofQUpvQ
Comprar criptomoedas
cartão
Negociação P2P
Compre USDT via marketplace
Cartão de Crédito/Débito
Compre criptomoedas com Visa ou Mastercard
Pagamento de terceiros
Compre criptomoedas pela MoonPay, Simplex e outras
Cartão BitMart
Fortalecendo sua jornada no mundo cripto
Cartão Pré-pago de Cripto
Obtenha seu Mastercard utilizável na hora
USDⓈ-M
Usando USDⓈ como garantia
COIN-M
Usando a própria MOEDA como garantia
TradFi
Negociação em um só lugar para metais, ações e forex
Demo de Trading
Aprenda a negociar sem risco
Visão geral dos Futuros
Plataforma única para tudo o que é relacionados aos Futuros
Futures King
478.000 USDT em prêmios
Evoluir
Visão Geral do Earn
Ativos Parados, Ganhos com Facilidade no Earn
Economia
Ganhe juros com participações
Apostando
Aposta fácil, recompensas altas
Gestão de Patrimônio
Evolua seu patrimônio com uma equipe de ativos de alto nível
RWA
Mantenha BMRUSD e Aproveite os Rendimentos
Exclusivo VIP
Ganhos de forma estável para usuários VIP
Rewards
Hub de recompensas
Descubra recompensas exclusivas de até 14.000 USDT
LaunchPrime
Uma plataforma de lançamento de token e NFT
Programa de Afiliados
Entre para ganhar altas comissões
Powerdrop
A Solução de Última Geração para Airdrops já está DISPONÍVEL!
Centro de eventos
Seu Hub para Todas as Operações Comerciais
Sorteio Diário de Futuros
Chance de ganhar em todas as negociações diárias
Sorteio diário Spot
Ganhe 8.888 USDT em Prêmios Incríveis
Stake to vote
Ganhe airdrops votando
Instituição
Serviços profissionais e exclusivos
VIP
Desbloquear recompensas exclusivas
Academia
Aprenda rapidamente sobre trading e blockchain
Estágio na BitMart
Comece sua carreira em cripto aqui
BitMart Travel
Serviços globais de viagem em um só lugar
INO
Uma plataforma de lançamento de NFTs
Faça Stake de BMX para Listagem
Compartilhar taxas de transação
APIS
Estabilidade robusta e inúmeros terminais
Programa de Corretores
Ganhe comissões pela integração da API
Notícias
Últimas notícias e visualizações
NFT MARKETPLACE
Um mercado de NFT como nenhum outro
Recarga de Celular
Recarregue celulares online de forma fácil e segura
Send
Send money globally, fast and secure
BitMart Mall
Viva com cripto

ICON (ICX)
$ 0.019 (ICX/USD)
0.00%
24H
ICON Dados de preços ao vivo
O preço atual de ICON é $ 0.019 (ICX/USD). Com um Market Cap de $ 21.92M USD, Volume de Trading em 24 horas de $ 1.54M USD, Uma Variação de Preço em 24 horas de +0.00%, E um Fornecimento Circulante de 1.10B ICX.
ICON ICX Histórico de Preços USD
Acompanhe o preço de ICON hoje e nos últimos 7, 30 e 90 dias
Período
Mudar
Alterar (%)
Hoje
$ 0
0.00%
7Dias
$ 0.0099
-33.33%
30Dias
$ 0.019
-50.00%
90Dias
$ 0.019
-50.00%
Adquira ICX agora
Compre e venda ICX de forma fácil e segura na BitMart.
ICON Informações de mercado
$ 0.019 Intervalo de 24h $ 0.019
Máximo histórico
$ 0.059
Mínimo histórico
$ 0.019
Alteração 24h
0.00%
24h Vol
$ 1,539,583.84
Fornecimento circulante
1.09B
ICX
Capitalização de mercado
$ 21.92M
Fornecimento máximo
--
Capitalização de mercado totalmente diluída
$ 22.15M
Comércio ICX
Ganhar
Coloque suas criptomoedas ociosas para trabalhar e ganhe renda passiva com poupança, staking e muito mais.
ICON X Insight

Aalexxx™
Media
Researcher
C
 3.6K @Aaleks_crypt
 Extremamente Bearish
ICON will shut down on December 31, 2026, and holders must migrate to SODA.
 2
2
 0
0
 28
28
2026-05-27 12:38
Tendência de ICX após o lançamento
Baixista
ICON will shut down on December 31, 2026, and holders must migrate to SODA.

吴说区块链
Media
Educator
D
177.6K @wublockchain12 Extremamente Bearish
ICX will shut down its network on December 31, 2026 and migrate to SODA, outlook bleak
South Korea's veteran public chain ICON announced that it will officially shut down its network on December 31, 2026, and complete the migration to SODAX. The official stated that the final migration deadline from ICX to SODA is also December 31, 2026, after which ICX will no longer be able to migrate. ICON said that as cross-chain and liquidity infrastructure mature, maintaining the Layer 1 no longer aligns with the project's direction. https://t.co/cqZvbnvoT2
2
2
2.9K
2026-05-25 14:56
Tendência de ICX após o lançamento
Baixista
ICX will shut down its network on December 31, 2026 and migrate to SODA, outlook bleak

Crypto Patel
TA_Analyst
OnChain_Analyst
B
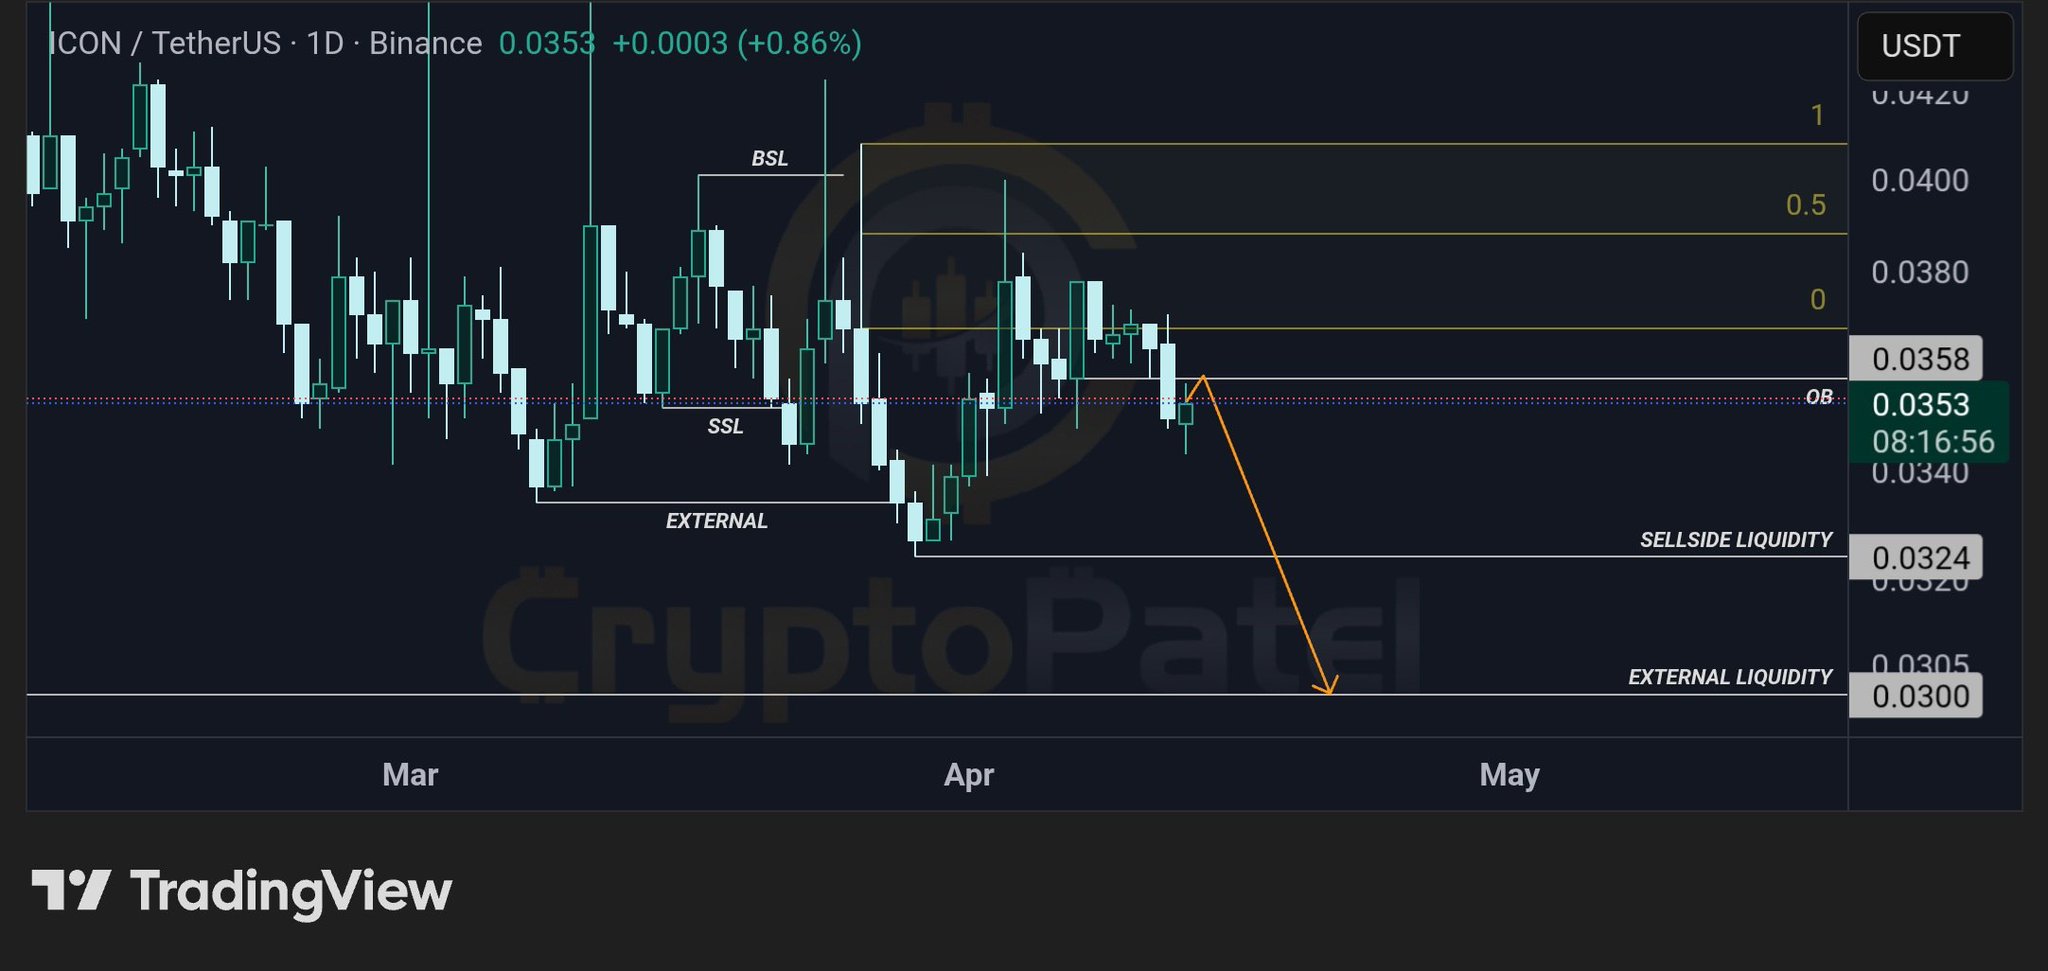
60.9K @CryptoPatel Baixista
ICX technical outlook shows weakness, expected to continue falling to $0.0324‑$0.0300.
$ICX/USDT 1D SETUP | BEARISH CONTINUATION TOWARD SELL-SIDE LIQUIDITY
#ICX is reacting from a higher timeframe order block in a premium zone, showing weak bullish continuation and signs of distribution, favoring downside continuation toward liquidity below.
Technical Structure:
✅ Daily Order Block → strong resistance in premium zone
✅ Prior rejection → bearish intent confirmed
✅ Weak bullish continuation → distribution behavior
✅ HTF bearish structure forming
✅ Liquidity below → clear downside targets
Targets: $0.0324 → $0.0300
Invalidation: 1D close above $0.0387
Bearish bias. Wait for minor pullback / rejection inside OB and confirmation before entering toward sell-side liquidity.
TA Only. DYOR.
 230
11
5.7K
230
11
5.7K
2026-04-14 05:33
Tendência de ICX após o lançamento
Extremamente Bearish
ICX technical outlook shows weakness, expected to continue falling to $0.0324‑$0.0300.
Previsão de preço
Quando é um bom momento para comprar ICX? Devo comprar ou vender ICX agora?
Ao decidir se é um bom momento para comprar ou vender ICON (ICX), é importante primeiro se alinhar à sua própria estratégia de trading e perfil de risco. Investidores de longo prazo e traders de curto prazo geralmente interpretam as condições de mercado de forma diferente, então sua decisão deve refletir a sua abordagem pessoal. De acordo com a análise técnica de 4 horas mais recente de ICX, o sinal de trading atual é Hold. De acordo com a mais recente análise técnica de 1 dia de ICX, o sinal atual é Hold.

Previsão do Beacon
Previsão Probabilística de Preço (Próximas 24 horas)Aviso de Isenção de Responsabilidade de Previsões do Beacon
Os resultados dos dados exibidos nesta página são analisados com base em dados de negociação reais (OHLCV) do par de trading selecionado, juntamente com indicadores técnicos correspondentes.
Esta previsão é um produto técnico experimental, fornecida apenas para fins de referência. Ela não constitui uma orientação de investimento. Eventos inesperados no mundo real podem afetar significativamente o comportamento do mercado. Os traders devem tomar decisões com cautela.
Esta previsão é um produto técnico experimental, fornecida apenas para fins de referência. Ela não constitui uma orientação de investimento. Eventos inesperados no mundo real podem afetar significativamente o comportamento do mercado. Os traders devem tomar decisões com cautela.
Sobre ICON
ICON (ICX) is a cryptocurrency . ICON has a current supply of 1,108,792,174.2180953 with 1,097,167,983.2979836 in circulation. The last known price of ICON is 0.02462115 USD and is down -1.06 over the last 24 hours. It is currently trading on 168 active market(s) with $681,925.96 traded over the last 24 hours. More information can be found at https://icon.community.
Leia mais
Links oficiais
Explorador de rede
Explore Mais
BM Discovery


Nova Listagem

CNT Centel
-- 0.00%

CRDOON Credo Technology Group Holding Ltd
-- 0.00%

BEON Bloom Energy Corp
-- 0.00%

DASHON DoorDash
-- 0.00%

APPON AppLovin Corporation
-- 0.00%

APLDON Applied Digital
-- 0.00%

NEEON NextEra Energy
-- 0.00%

ONON ON Semiconductor Corporation
-- 0.00%

SCHWON The Charles Schwab Corporation
-- 0.00%
ANSEM The Black Bull
-- 0.00%