#TAUSDT $TA #Binance #ALPHA
Low market cap, strong narrative.
Let’s send it flying. 🚀 https://t.co/RahMvMrVoV


 79.1K @CryptoTolga_
 #TAUSDT $TA #Binance #ALPHA
Low market cap, strong narrative.
Let’s send it flying. 🚀 https://t.co/RahMvMrVoV
79.1K @CryptoTolga_ #Bitcoin #Altcoin #Binance #AI
I’d say a massive #AI driven #bull run is ahead of us.
Keep a close eye on low market cap #AI projects during this period.
The biggest opportunities usually emerge before the crowd notices them.
Those who identify the right projects early could end up being the biggest winners of this cycle.
 47
47
 12
12
 5.1K
79.1K @CryptoTolga_ 79.1K @CryptoTolga_
5.1K
79.1K @CryptoTolga_ 79.1K @CryptoTolga_ #BİNANCE #Altcoin #BİTCOİN
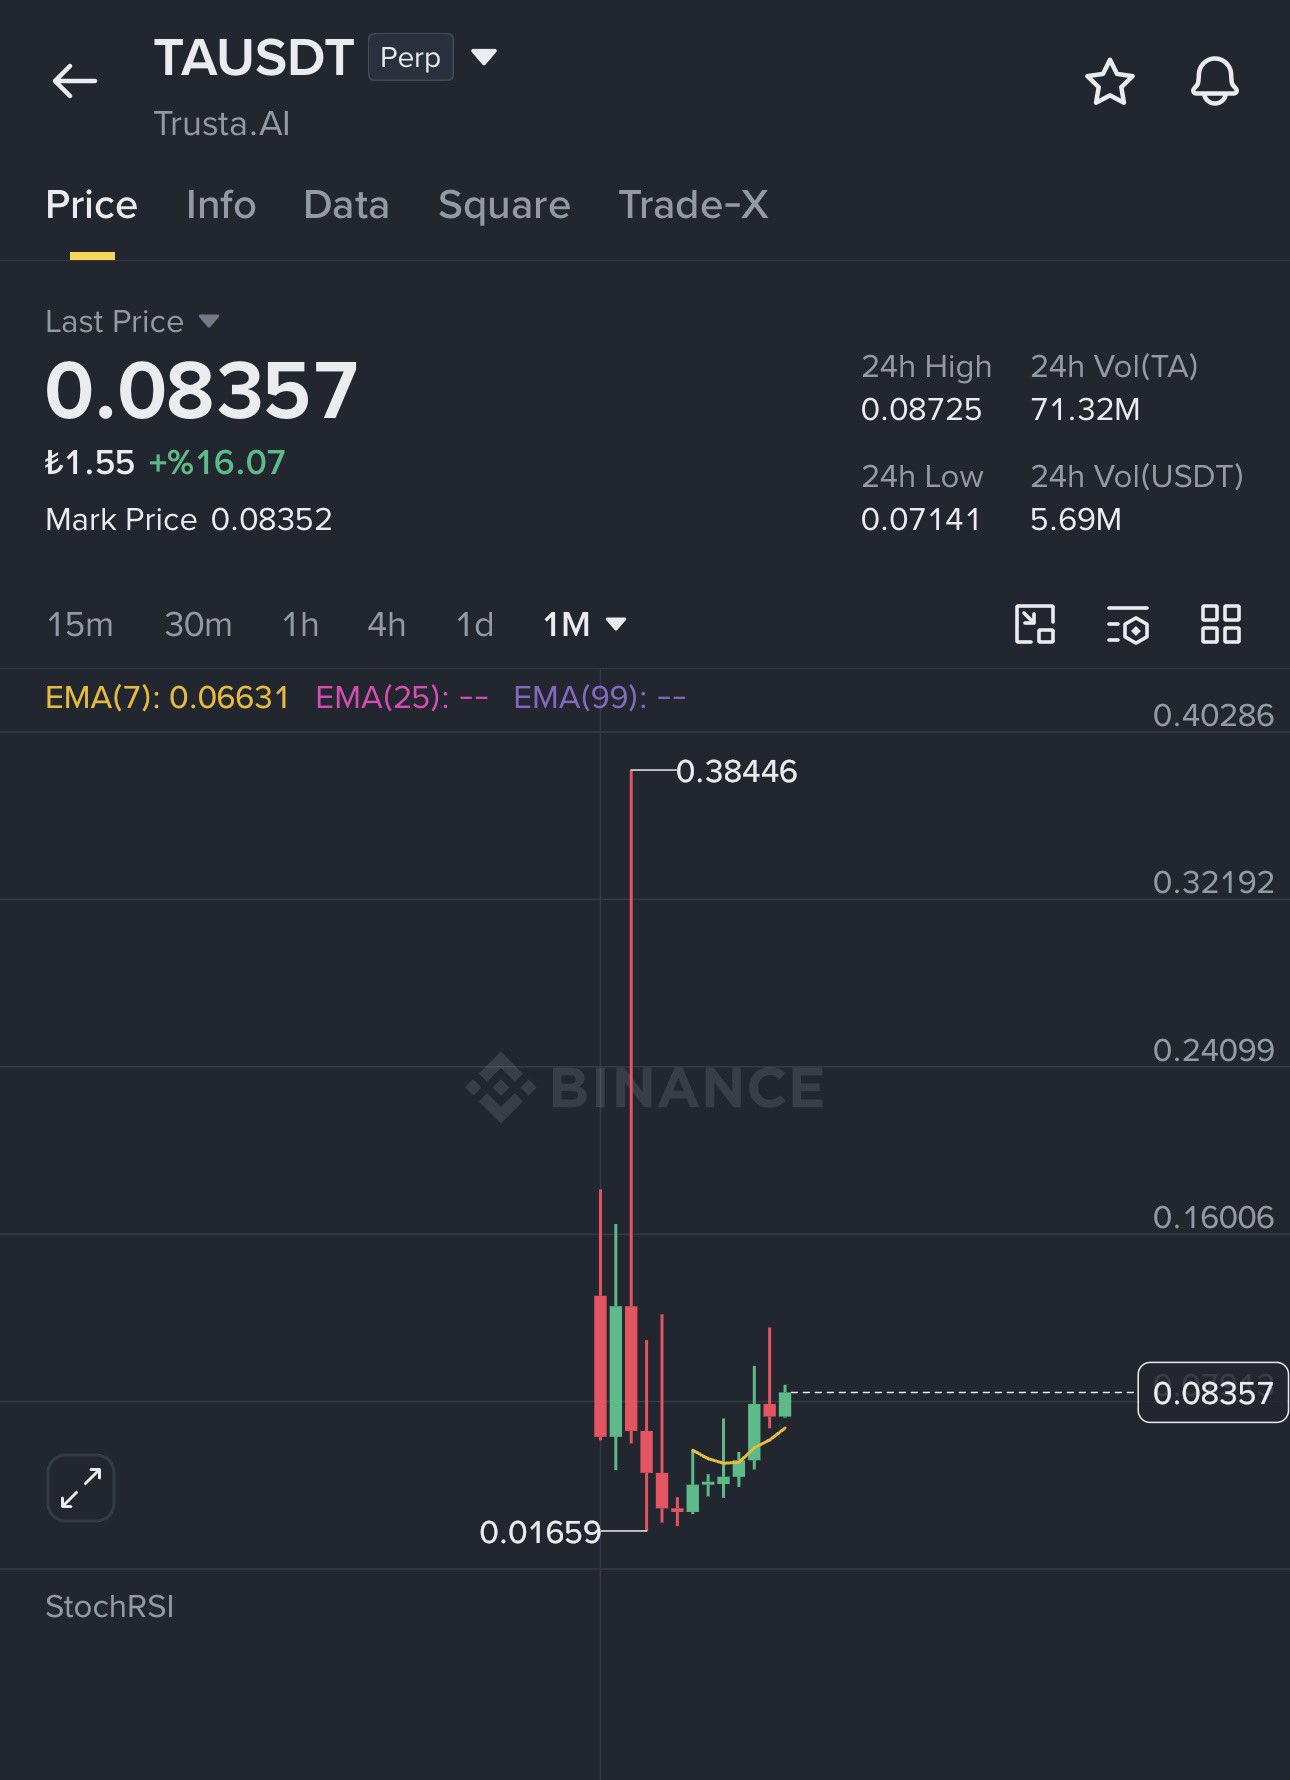
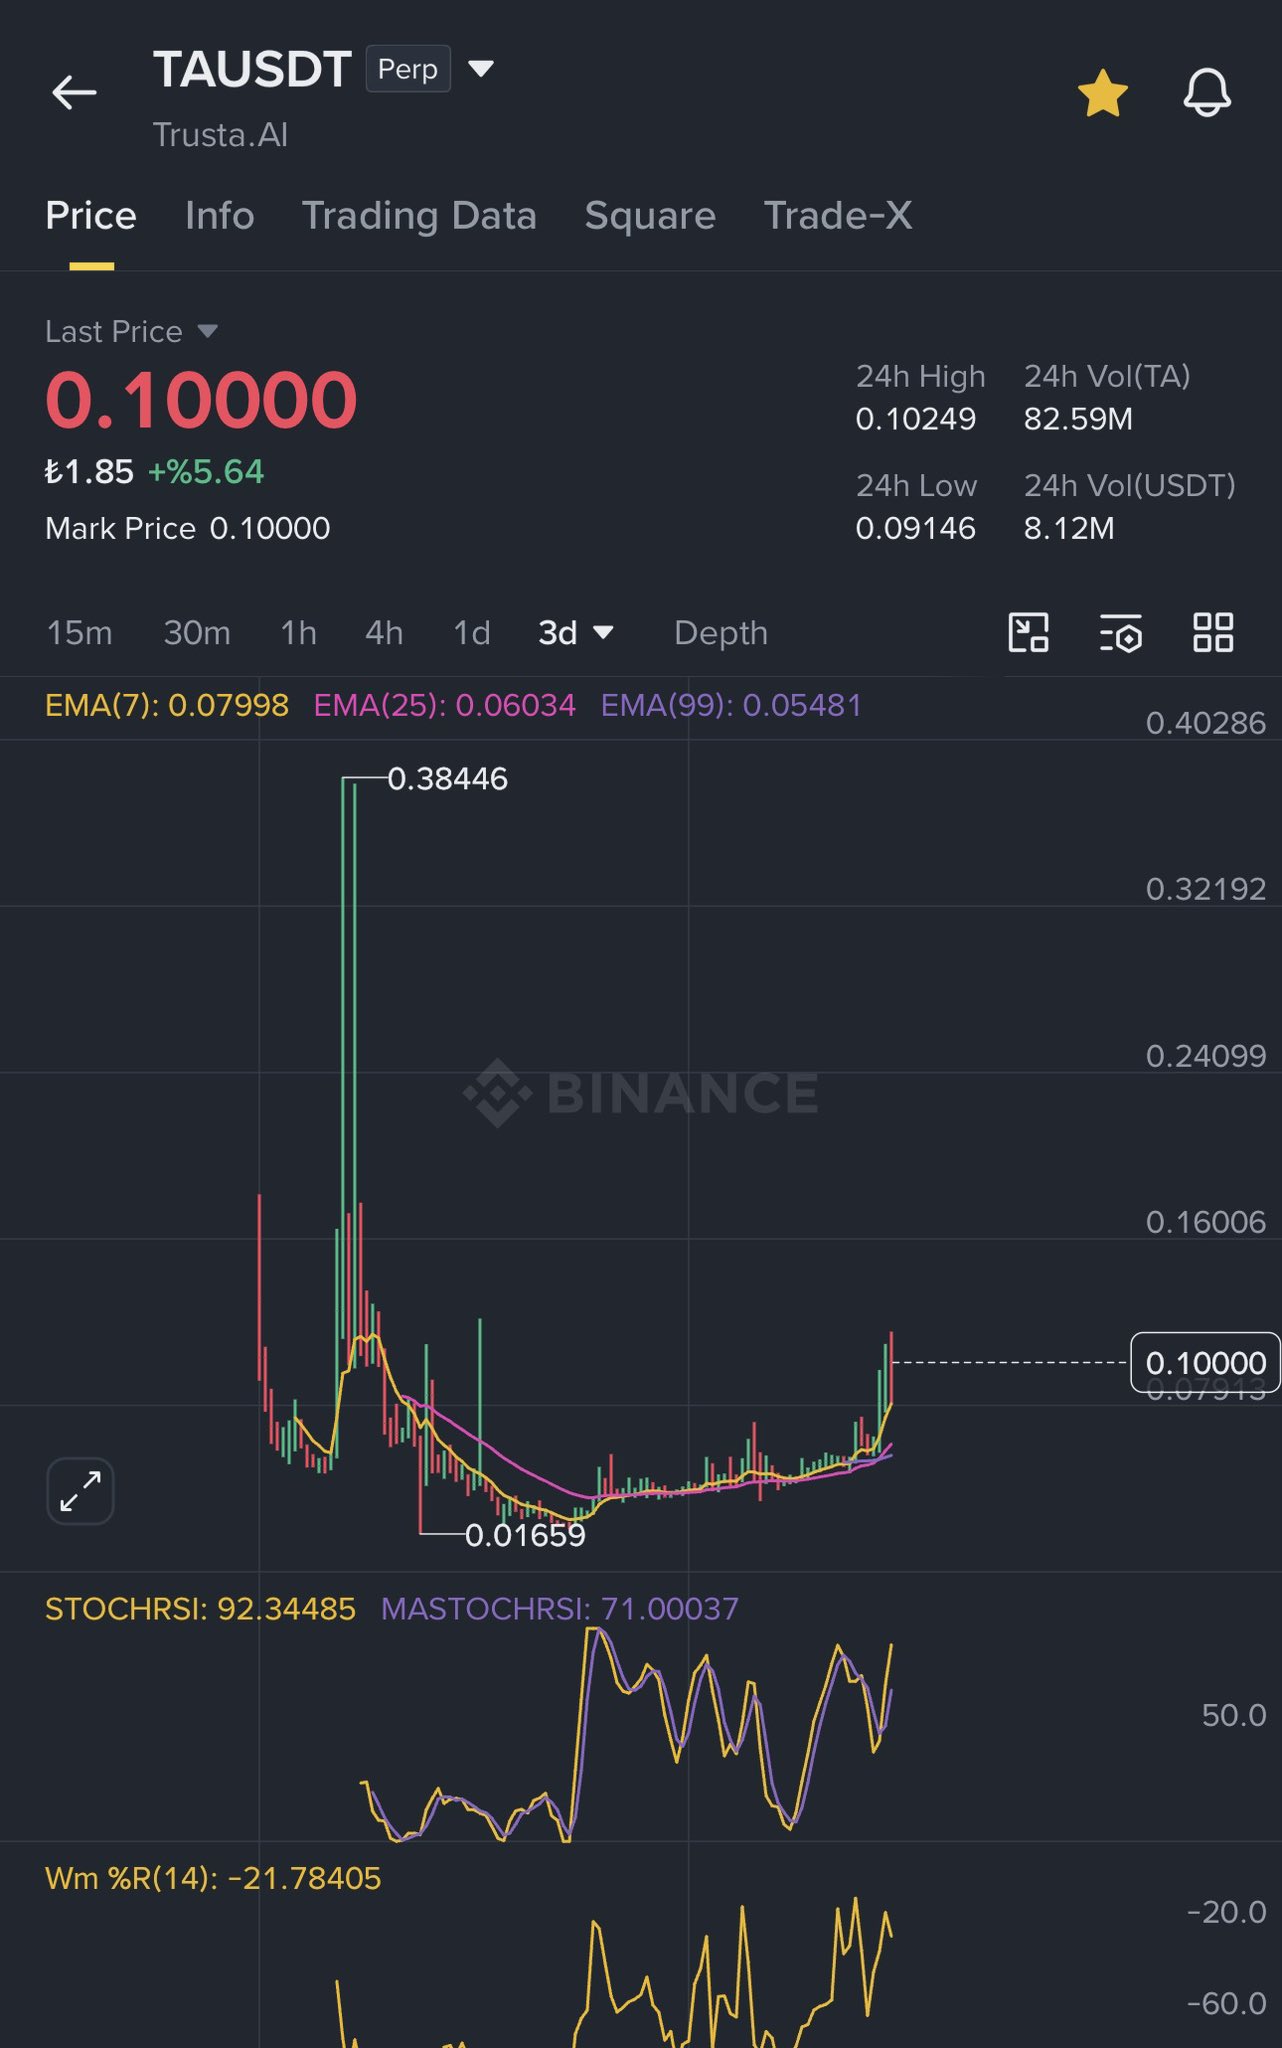
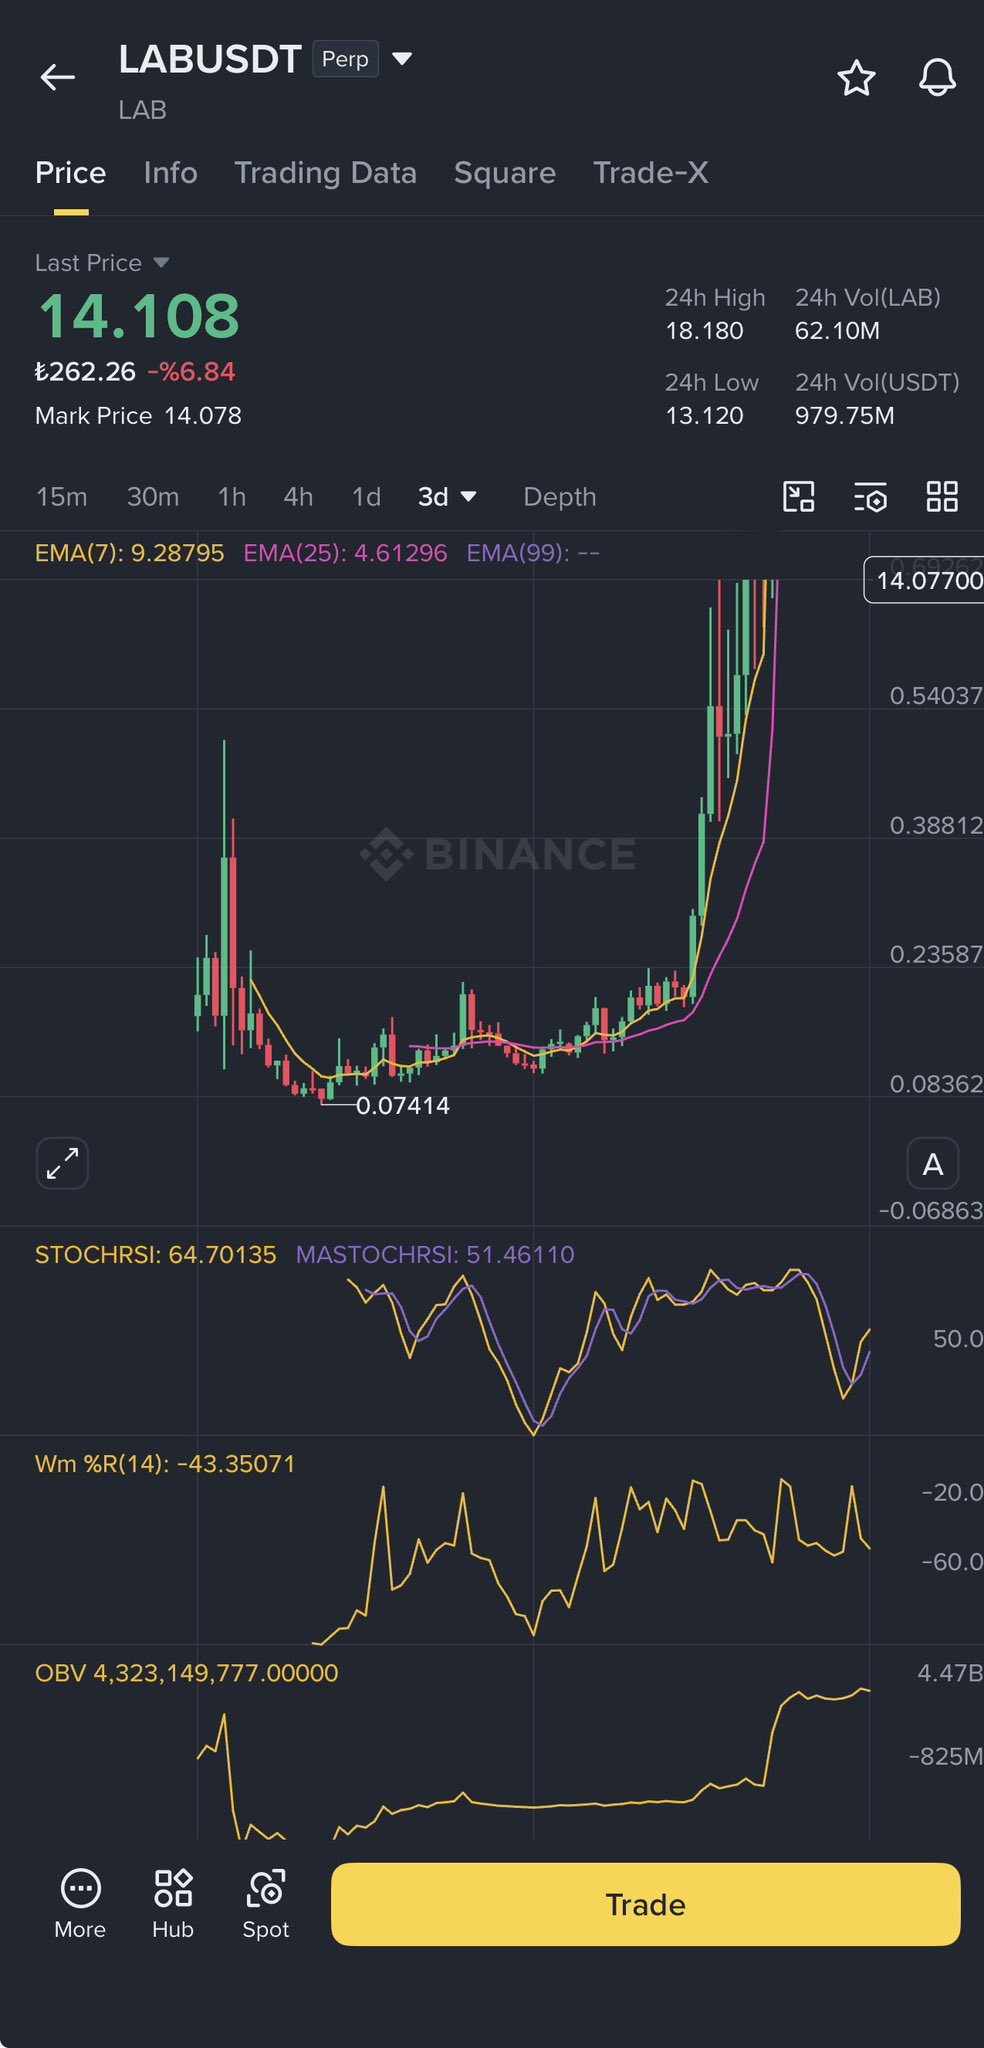
I see a lot of similarities between these two charts.
One of the main reasons is the market maker footprint.
Based on my research from publicly available sources, there are indications that both projects may have some level of GSR involvement.
From a technical perspective, #TA’s current structure strongly reminds me of #LAB’s price action around the $0.20 region.
The extended accumulation phase, gradually increasing volume, and recovery from the bottom all look remarkably similar.
Of course, there is no guarantee that the exact same scenario will play out.
However, based on the current setup, #TA appears to be one of the closest projects to the structure that #LAB formed before its major move.
#TA #LAB #Crypto #Altcoins
 81
18
13.2K
79.1K @CryptoTolga_
81
18
13.2K
79.1K @CryptoTolga_ #BİNANCE #Altcoin #BİTCOİN
I see a lot of similarities between these two charts.
One of the main reasons is the market maker footprint.
Based on my research from publicly available sources, there are indications that both projects may have some level of GSR involvement.
From a technical perspective, #TA’s current structure strongly reminds me of #LAB’s price action around the $0.20 region.
The extended accumulation phase, gradually increasing volume, and recovery from the bottom all look remarkably similar.
Of course, there is no guarantee that the exact same scenario will play out.
However, based on the current setup, #TA appears to be one of the closest projects to the structure that #LAB formed before its major move.
#TA #LAB #Crypto #Altcoins
81
18
13.2K