 Hashflow (HFT)
$0.01449 +4.92% 24H
- 73社交熱度指數(SSI)- (24h)
- #16市場預警排名(MPR)0
- 124小時社交提及量- (24h)
- 100%24小時KOL看好比例1位活躍KOL
- 概要
- 看漲訊號
- 看跌訊號
社交熱度指數(SSI)
- 總體資料73SSI
- 社交熱度趨勢(7D)價格(7D)情緒分佈看漲 (100%)社交熱度洞察
市場預警排名(MPR)
- 預警解讀
相關推文
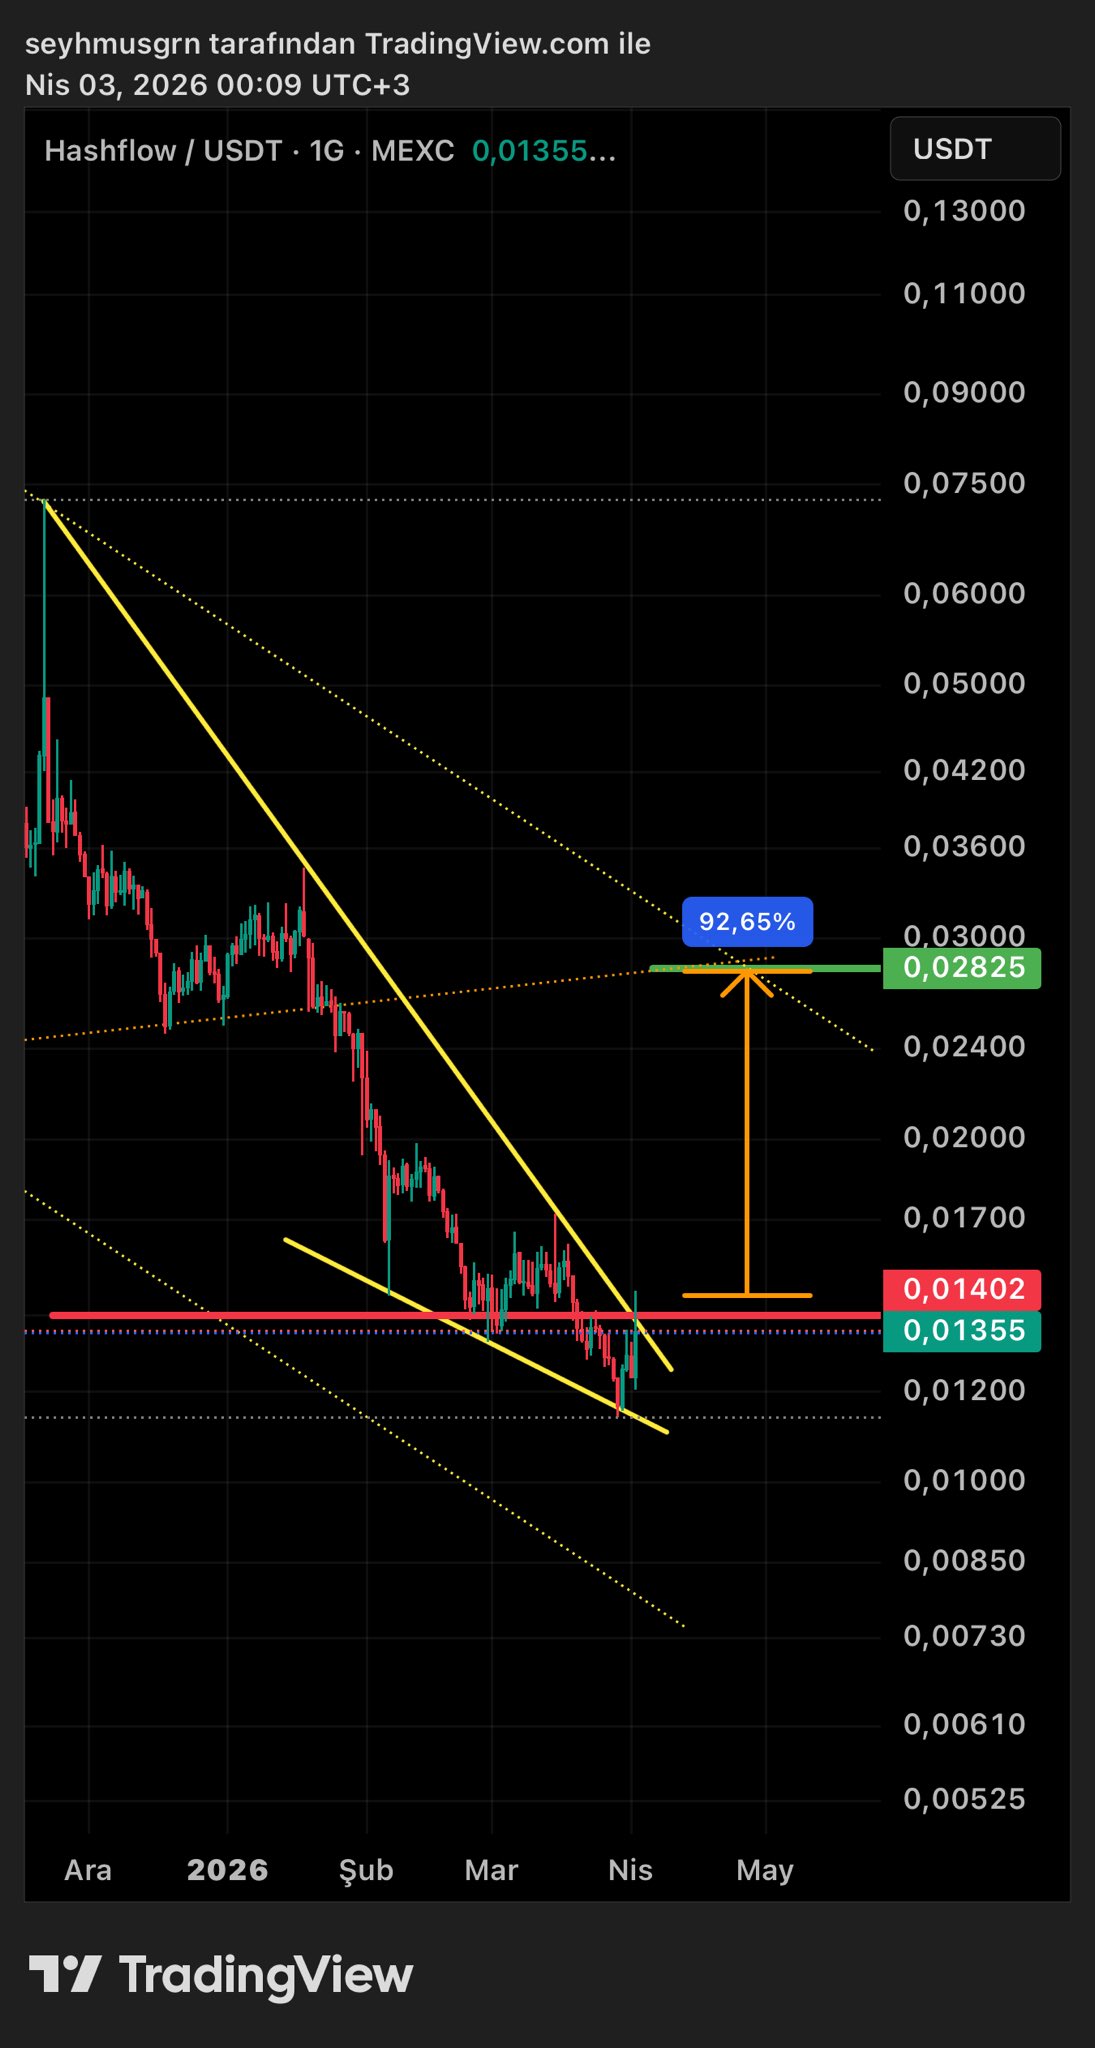
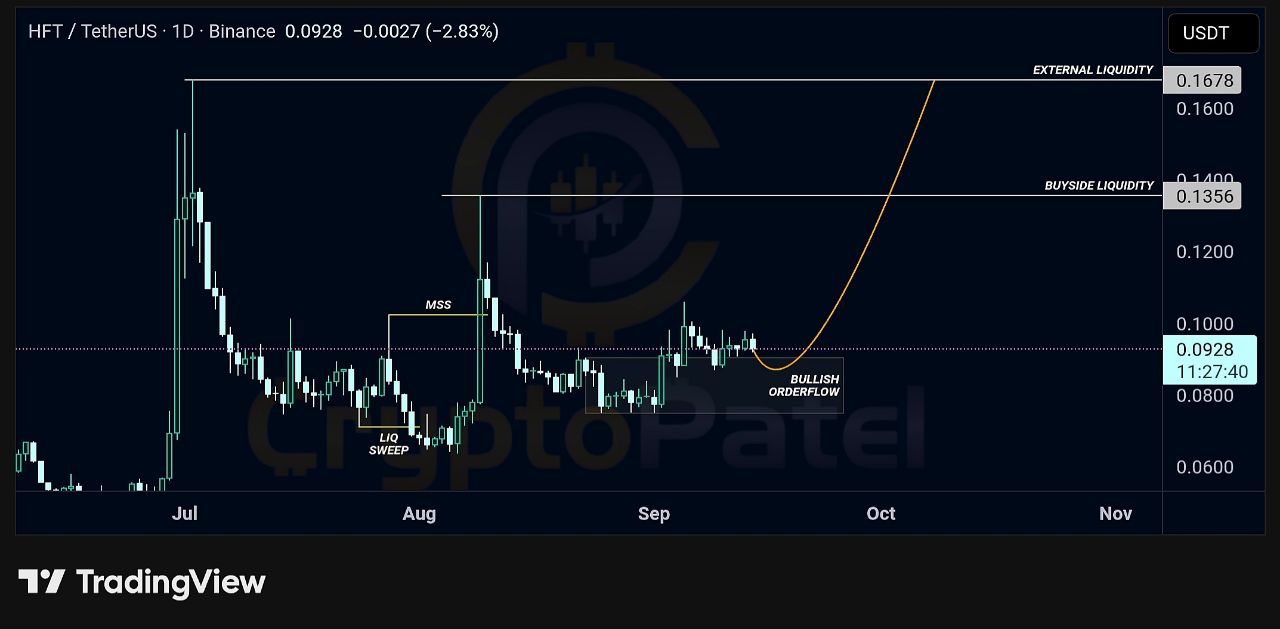
- 釋出後HFT走勢看漲
- 釋出後HFT走勢看漲
 𝒫𝓊𝒻𝒾 TA_Analyst Trader C6.46K @kriptopufi𝒫𝓊𝒻𝒾 TA_Analyst Trader C6.46K @kriptopufi
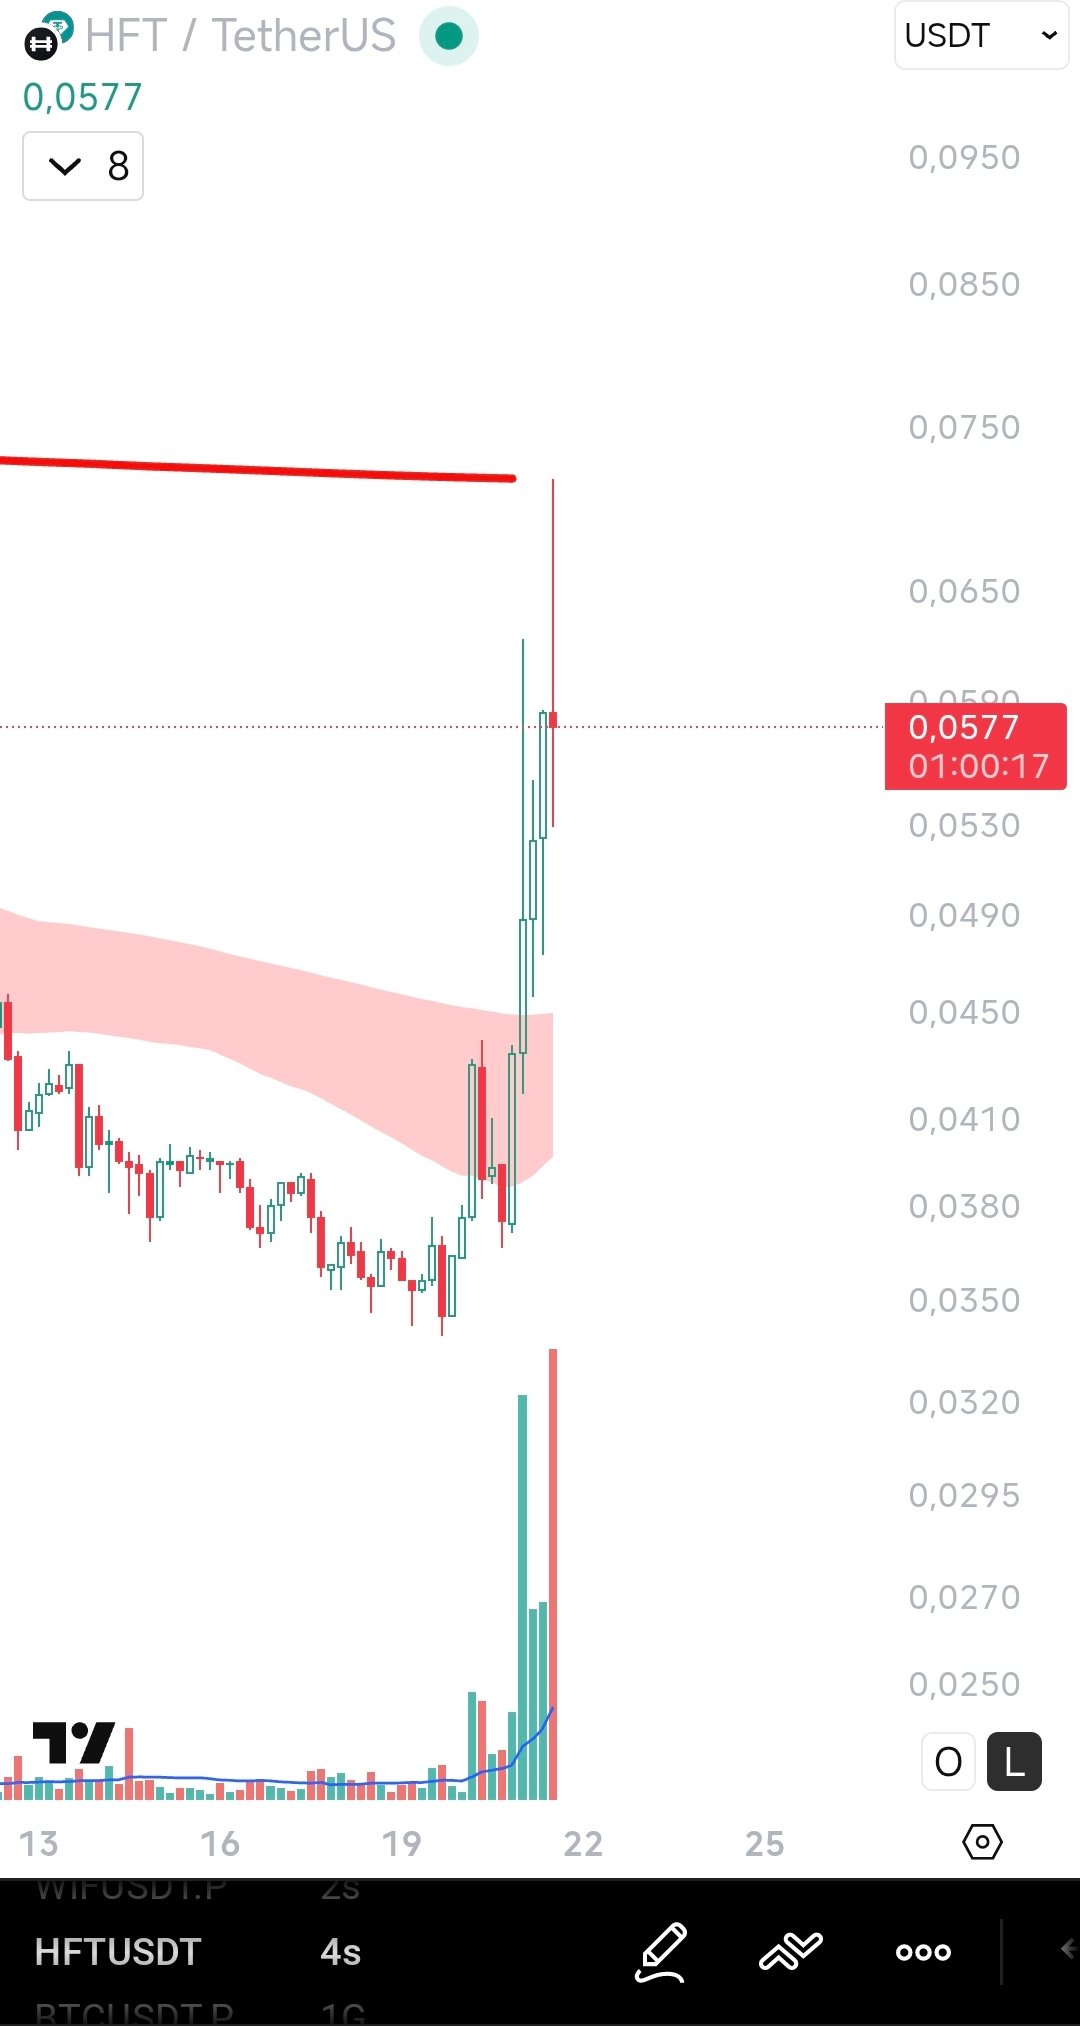 12 4 800 閱讀原文 >釋出後HFT走勢看漲
- 釋出後HFT走勢看漲
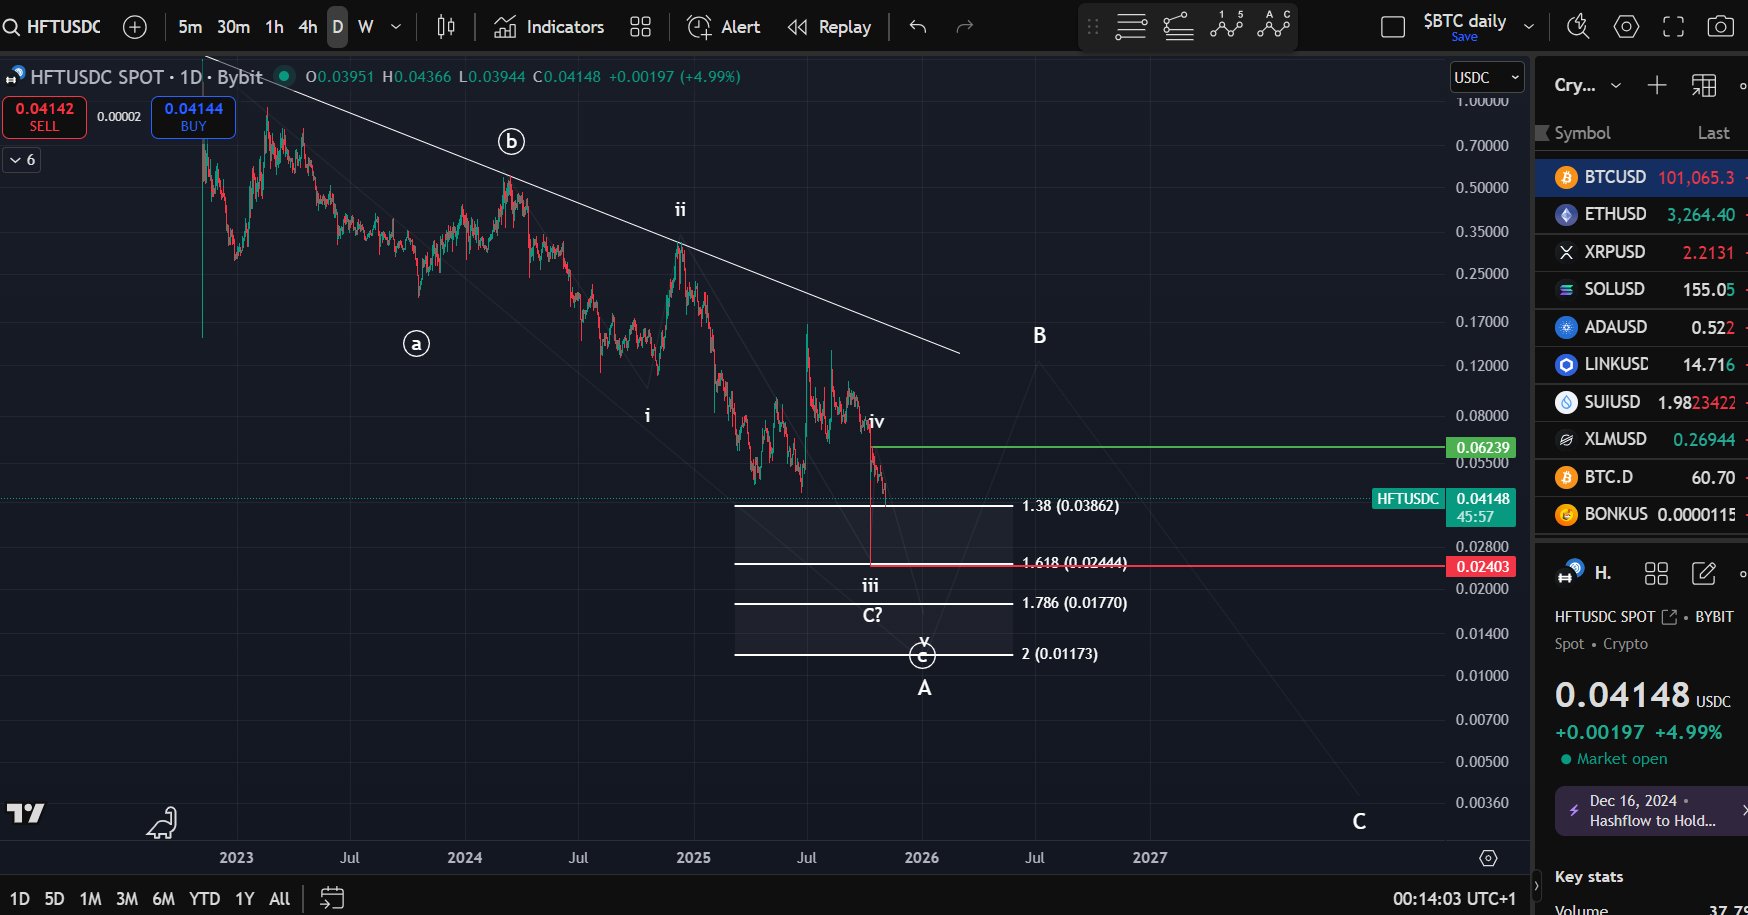
- 釋出後HFT走勢看跌
 SunOWL Meme Trader Derivatives_Expert D1.20K @sunowl_meme
 EliZ TA_Analyst Trader C605.61K @eliz883
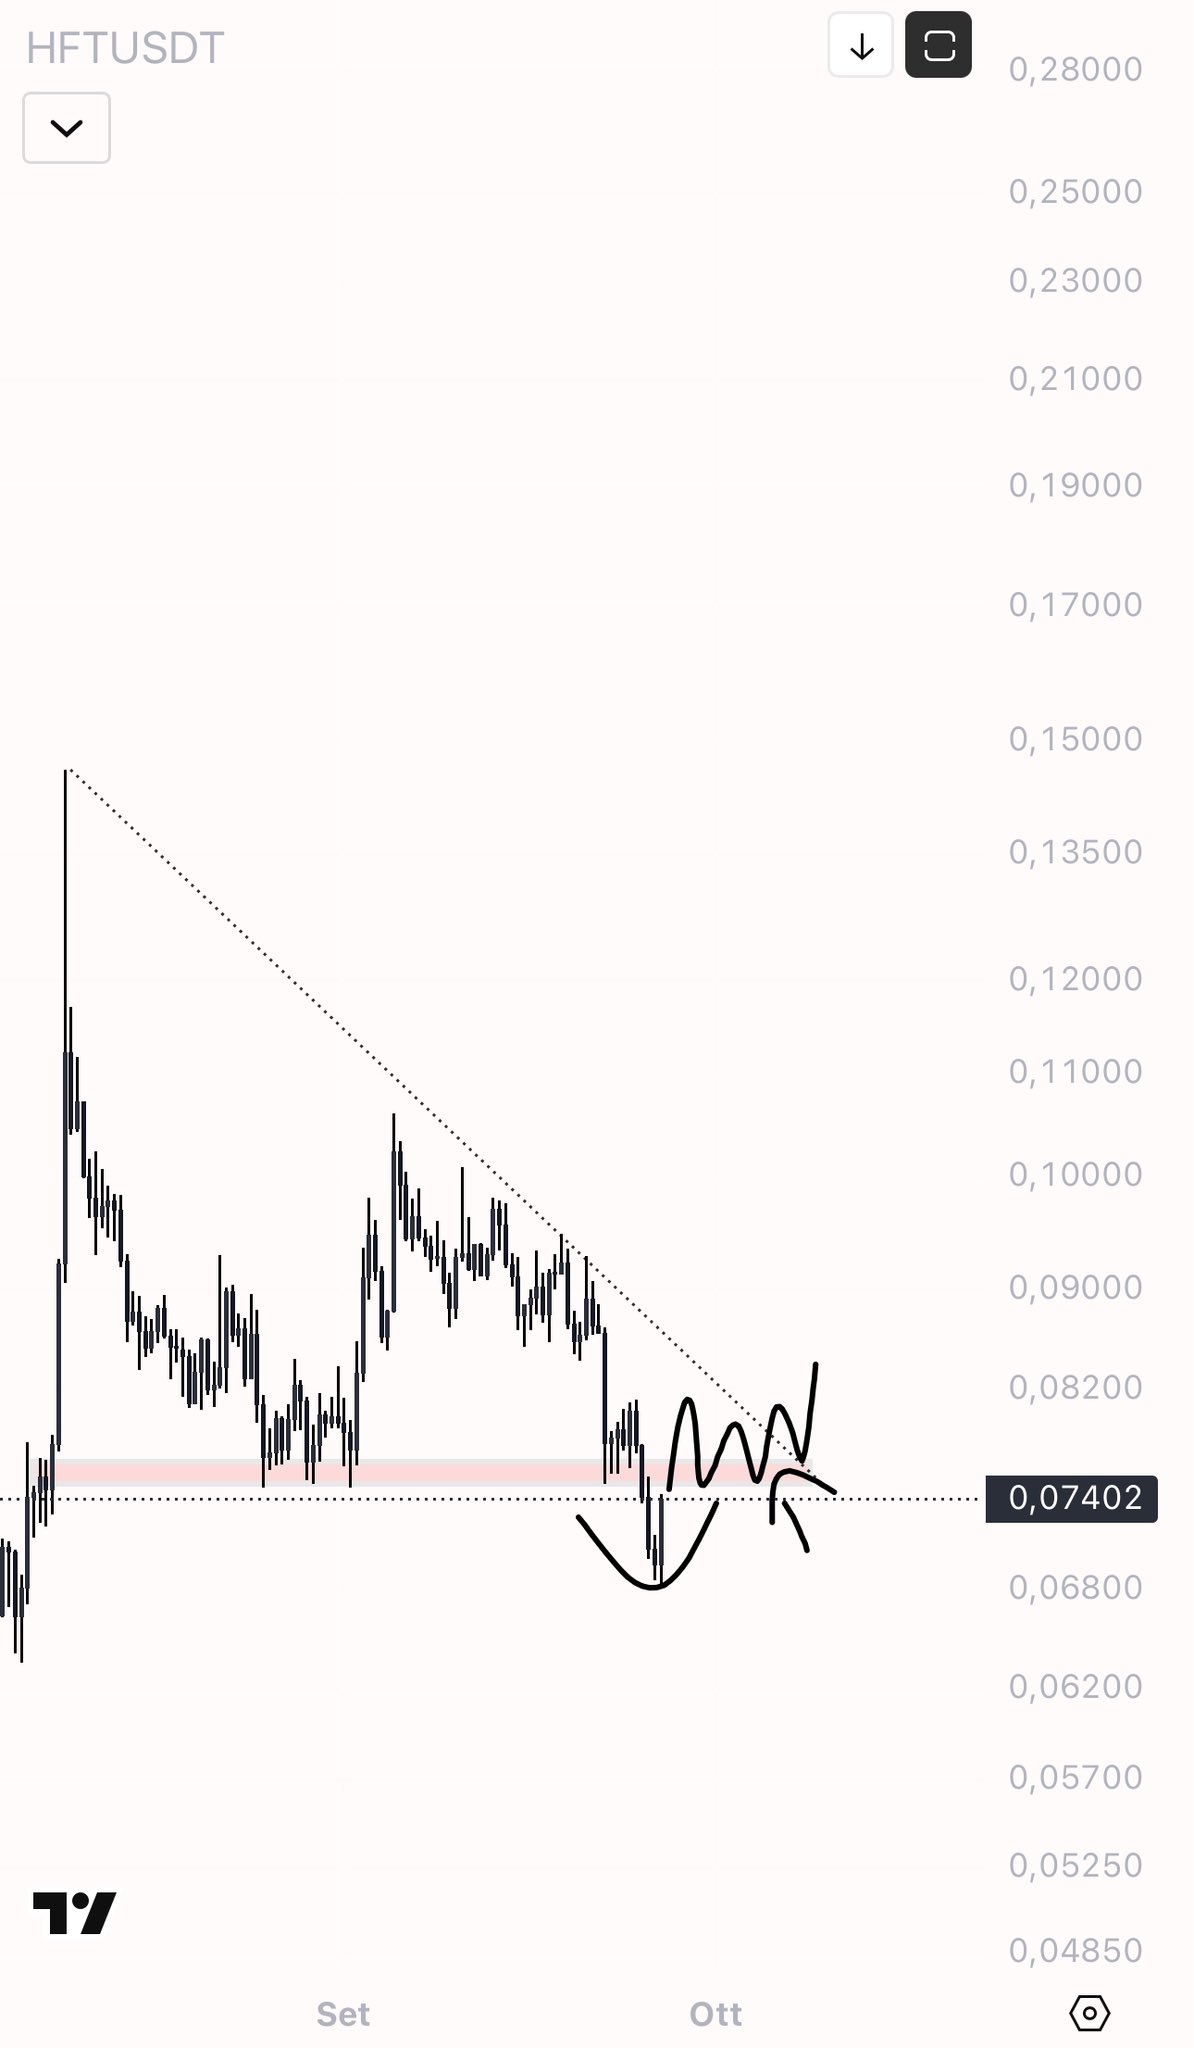 0 0 143 閱讀原文 >釋出後HFT走勢看跌
- 釋出後HFT走勢看漲
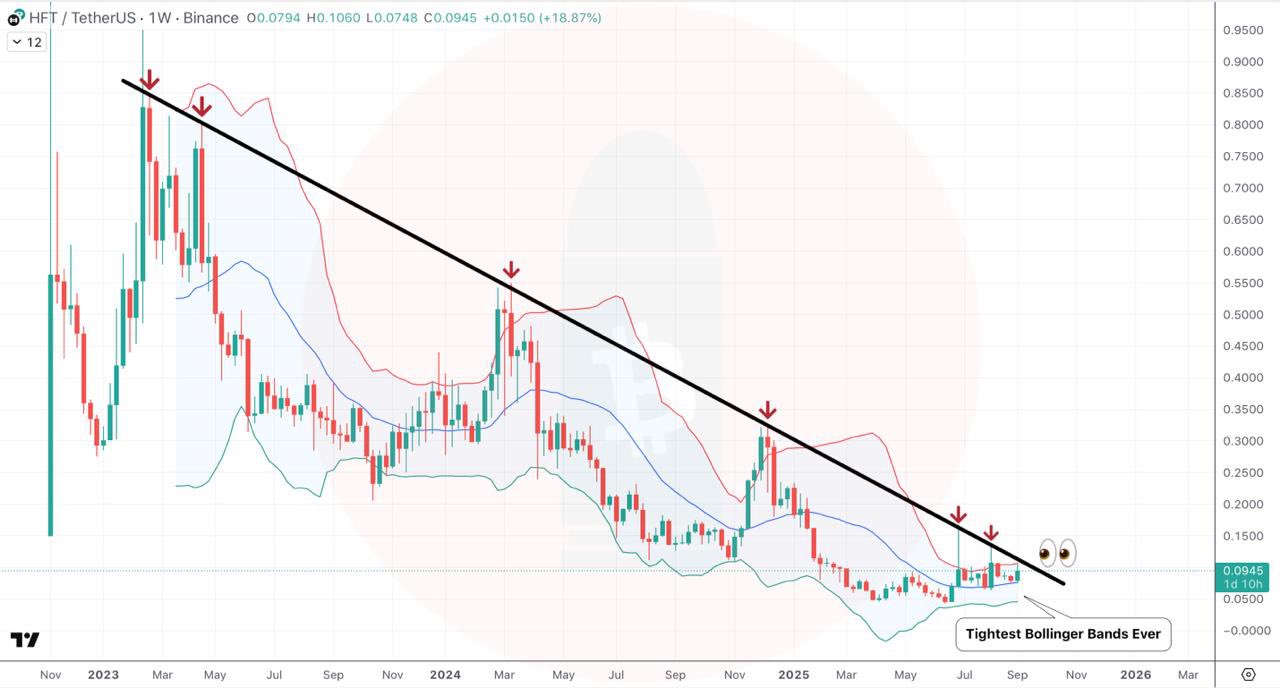
- 釋出後HFT走勢極度看漲
- 釋出後HFT走勢極度看漲
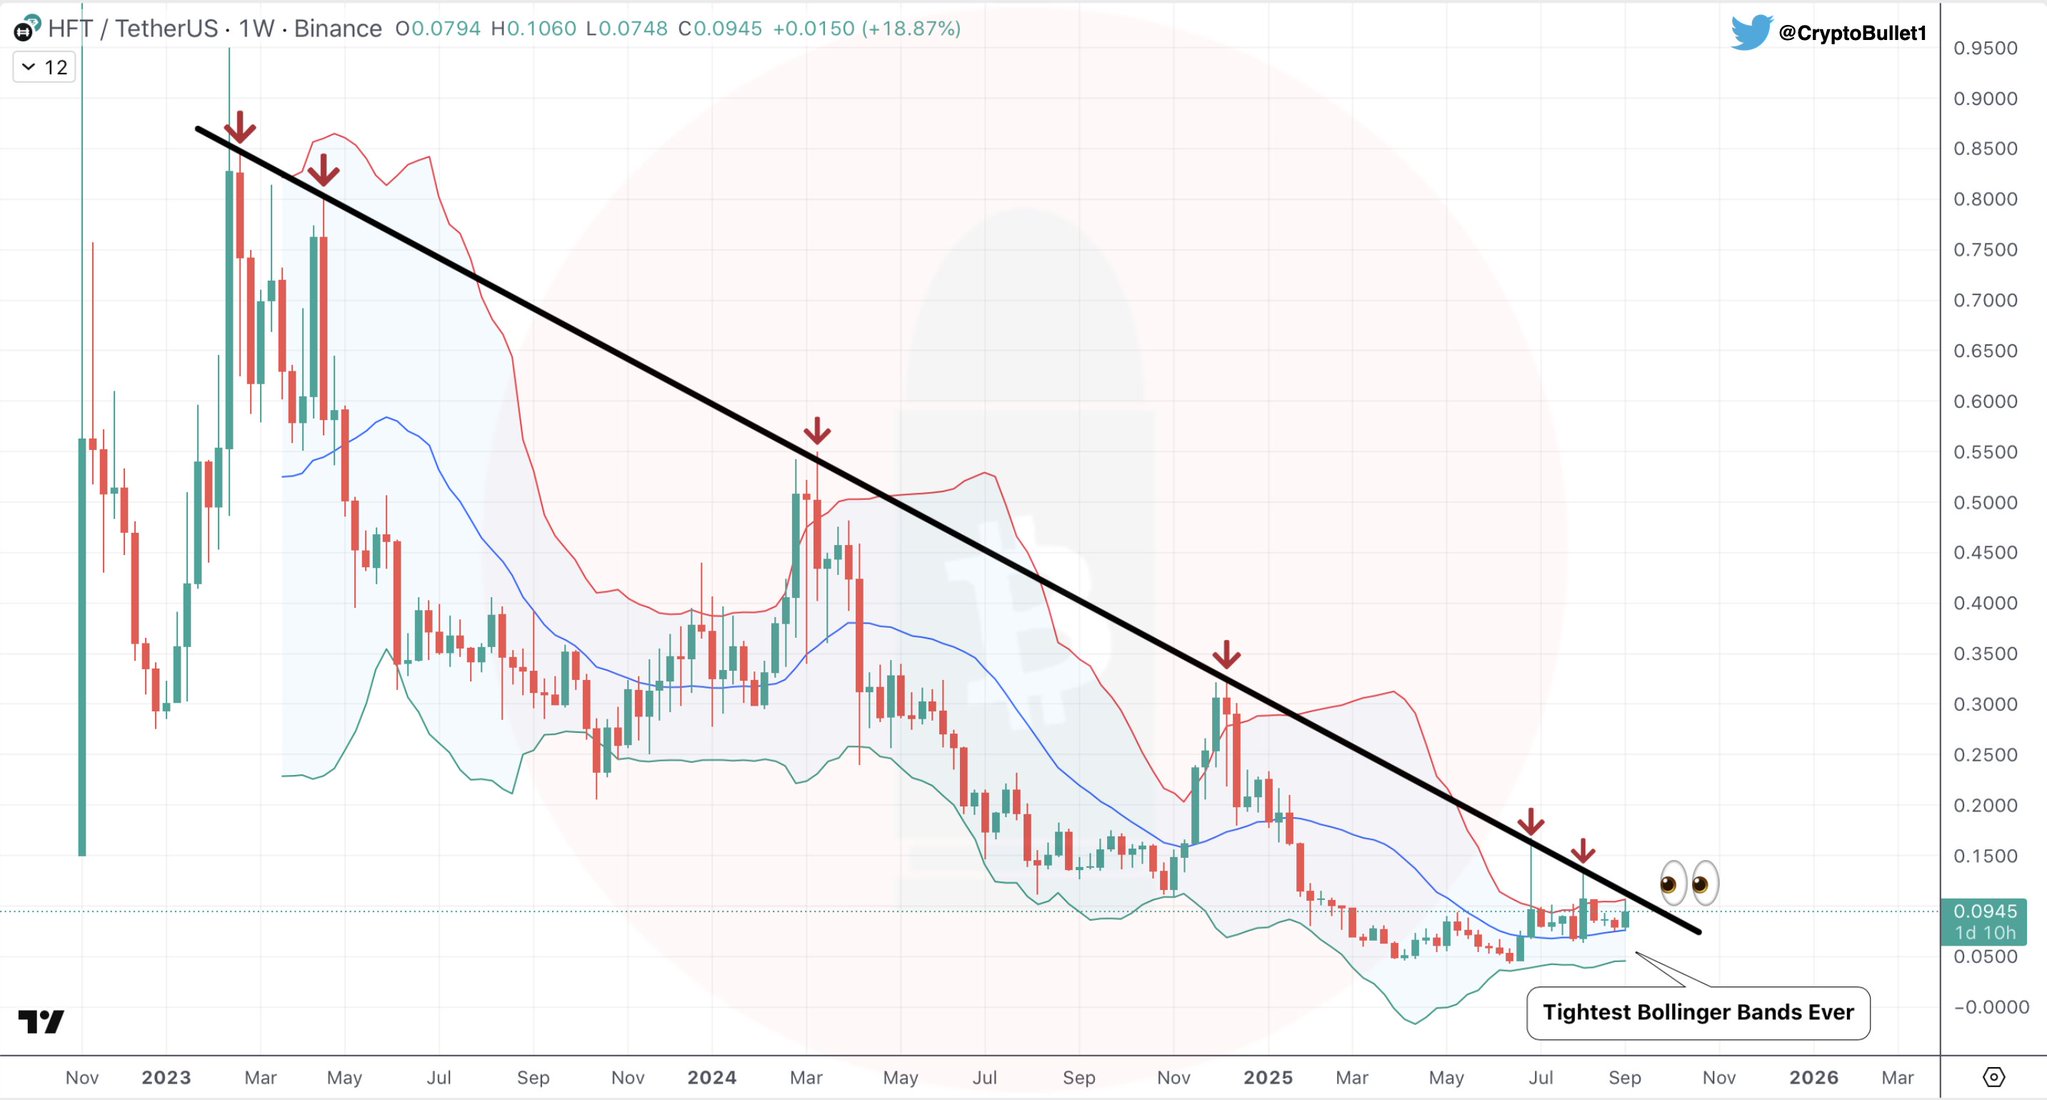
- 釋出後HFT走勢看漲