Начать
Отсканируйте, чтобы загрузить приложение
Для iOS и Android

Rigetti Computing Tokenized Stock (Robinhood) (RGTI)

$
$ 16.58 (RGTI/USD)
-5.74%
24H

Rigetti Computing Tokenized Stock (Robinhood) Данные о ценах в реальном времени

Today's price of Rigetti Computing Tokenized Stock (Robinhood) Is $ 16.58 (RGTI/USD). With A Market Cap Of $ 2,386.32 USD. 24-Hour Trading Volume Of $ 0 USD, A 24-Hour Price Change Of -5.74%, And A Circulating Supply Of 143.95 RGTI.

Rigetti Computing Tokenized Stock (Robinhood) RGTI Price History USD

Track the price of Rigetti Computing Tokenized Stock (Robinhood) for today, 7 days, 30 days and 90 days
Период
Изменить
Изменение (%)
Сегодня
$ 1.01
-5.74%
7дней
$ 1.10
-6.02%
30дней
$ 1.31
-7.09%
90дней
$ 1.31
-7.09%

Own RGTI Now

Buy and sell RGTI easily and securely on BitMart.
Buy/Sell RGTI Now
Buy/Sell {0} Now
Rigetti Computing Tokenized Stock (Robinhood) Информация о рынке
Последняя цена $ 16.58
$ 16.54 24 часа $ 17.59
Рекордный максимум
‎$ 19.34‎
Рекордный минимум
‎$ 16.54‎
Изменение за 24 часа
‎-5.74%‎
Объем за 24 часа
‎$ 0‎
Количество токенов в обороте
143.95 RGTI
Рыночная капитализация
‎$ 2,386.32‎
Максимальное предложение
--
Рыночная капитализация при полной эмиссии
‎$ 2,386.32‎
Торговать RGTI

Заработать

Даже незадействованная криптовалюта может приносить пассивный доход! Пользуйтесь сбережениями, услугами стейкинга и другими преимуществами.
Попробовать сейчас
Попробовать сейчас

Rigetti Computing Tokenized Stock (Robinhood) Инсайт из X

avatar
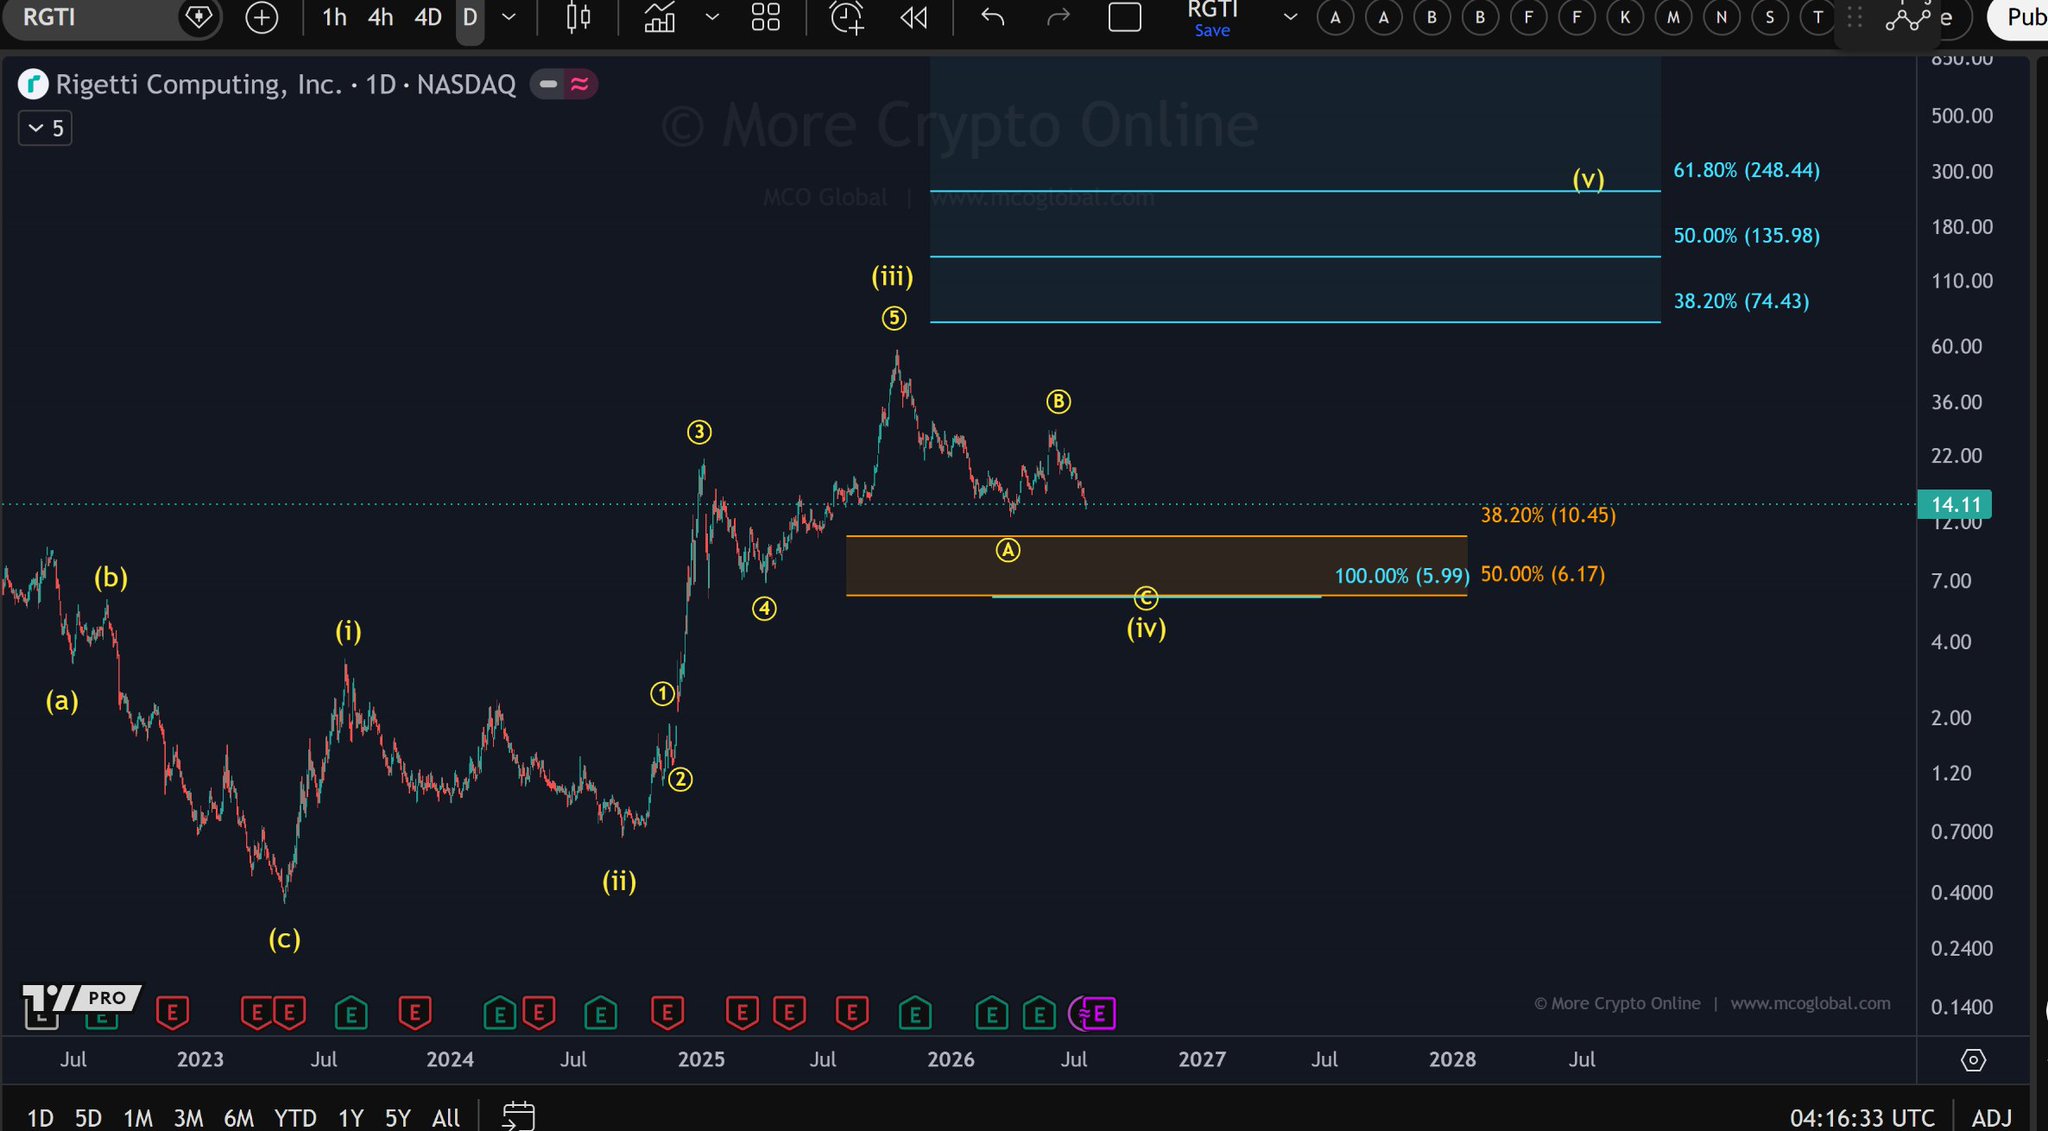
RGTI is in a correction phase, expected to fall to the $5.99-$10.45 support zone.

$RGTI
RGTI remains in a correction phase from the peak of wave (iii), and the move from the peak of wave B still aligns with a still-unfinished decline of wave C.
Leading scenario: The preferred view is that wave (iv) is still incomplete. The decline from the peak of wave B could continue towards the orange support zone between 10,45 $ and 6,17 $, with the 100% C-wave extension around 5,99 $. A move into this area would still fit the structure of the correcting wave (iv) and would not invalidate the count.
Risk scenario: Should the price reverse strongly before reaching the lower support zone and rise back above the recent recovery high, wave (iv) may have completed earlier than expected. On the downside, a sustained break below the 6 $ region would make the correction deeper than ideal and increase the likelihood of a more complex structure.
Key support levels: 10,45 $ / 6,17 $ / 5,99 $ Key resistance levels: 74,43 $ / 136 $ / 248 $ Conclusion: RGTI continues to be viewed as an unfinished (iv) correction wave, with the C-wave decline allowed to extend into the support zone of 10,45 $ to 5,99 $ before a larger (v) wave attempt becomes relevant.
view 22
view 1
view 2.3K
2026-07-18 07:12
Тренд RGTI после выпуска
Медвежий
RGTI is in a correction phase, expected to fall to the $5.99-$10.45 support zone.
avatar
RGTI and IONQ gain fresh attention, retail funds shift to quantum AI

🧠 Quantum names $RGTI and $IONQ are pulling fresh attention as retail rotates out of crowded mega-cap AI.

view 7
view 1
view 6.9K
2026-07-07 07:27
Тренд RGTI после выпуска
Бычий
RGTI and IONQ gain fresh attention, retail funds shift to quantum AI
avatar
RGTI is hovering around the $15.30 support level, with a breakout still pending confirmation.

$RGTI
RGTI trades between the next support at $15.30 and the red Fibonacci resistance zone above it. The yellow and blue counts remain fairly balanced, with the proposed wave 1 circle still speculative and should be viewed more as a potential leading diagonal rather than a clear impulse.
Leading scenario: The yellow count can be seen as a possible 1-2 setup, with wave 2 circle still correcting after the rise in May. Holding the area around $15.30 would keep this structure intact, but the next upward attempt needs a stronger reaction before the bullish price gains weight. Risk scenario: Should the $15.30 level give way, the blue ABC interpretation becomes more likely. This would shift focus to the lower red support and possibly the orange support zone, where a C‑wave decline could develop before a larger trend reversal is attempted. Key support levels: $15.30 / ~$12.80 / $10.50–6.20
Key resistance levels: $27.11–49.17
Conclusion: For RGTI there is still no clear advantage between the yellow and blue scenarios. $15.30 is the first level that decides whether the potential 1-2 setup can hold or whether the deeper correction path takes precedence.

view 6
view 1
view 1.8K
2026-07-04 09:12
Тренд RGTI после выпуска
Нейтрально
RGTI is hovering around the $15.30 support level, with a breakout still pending confirmation.
Подробнее

Прогнозирование цен

When is a good time to buy RGTI? Should I buy or sell RGTI now?

When deciding whether it’s a good time to buy or sell Rigetti Computing Tokenized Stock (Robinhood) (RGTI), it’s important to first align with your own trading strategy and risk profile.Long-term investors and short-term traders often interpret market conditions differently, so your decision should reflect your personal approach. According to the latest RGTI 4-hour technical analysis, the current trading signal is Hold.
60
Hold
4-hour technical analysis of RGTI
Last Update 2026-08-20 11:59:59
beacon

Прогноз Beacon

Probabilistic Price Forecast (Next 24 Hours)
i
Отказ от ответственности за прогноз Beacon
The data results displayed on this page are analyzed based on actual trading data (OHLCV) of the selected trading pair along with corresponding technical indicators.
This prediction is an experimental technical product and is provided for reference purposes only. It does not constitute investment advice. Unexpected real-world events may significantly impact market behavior. Traders should make decisions with caution.
О нас Rigetti Computing Tokenized Stock (Robinhood)
Rigetti Computing Tokenized Stock (Robinhood) (RGTI) is a cryptocurrency and operates on the Robinhood Chain platform. Rigetti Computing Tokenized Stock (Robinhood) has a current supply of 143.953. The last known price of Rigetti Computing Tokenized Stock (Robinhood) is 18.86331123 USD and is up 0.60 over the last 24 hours. It is currently trading on 11 active market(s) with $0.00 traded over the last 24 hours. More information can be found at https://robinhood.com/us/en/.
Читать далее